HOT TOPICS LIST
- MACD
- Fibonacci
- RSI
- Gann
- ADXR
- Stochastics
- Volume
- Triangles
- Futures
- Cycles
- Volatility
- ZIGZAG
- MESA
- Retracement
- Aroon
INDICATORS LIST
LIST OF TOPICS
PRINT THIS ARTICLE
by David Penn
A break below support at the 50-day EMA and a confirming close make for a lower USD/CHF.
Position: N/A
David Penn
Technical Writer for Technical Analysis of STOCKS & COMMODITIES magazine, Working-Money.com, and Traders.com Advantage.
PRINT THIS ARTICLE
REVERSAL
Bearish mMm Pattern Breaks The Greenback/Swissy Down
09/07/07 11:35:40 AMby David Penn
A break below support at the 50-day EMA and a confirming close make for a lower USD/CHF.
Position: N/A
| The thrill — and profitability — of successfully shorting a negative divergence or shooting star Japanese candlestick pattern at a market top is not to be underestimated. But the fact remains that one of the most effective ways of betting against a market is to do so when a market that has already shown weakness, fails to move higher after encountering resistance, and begins to move down. |
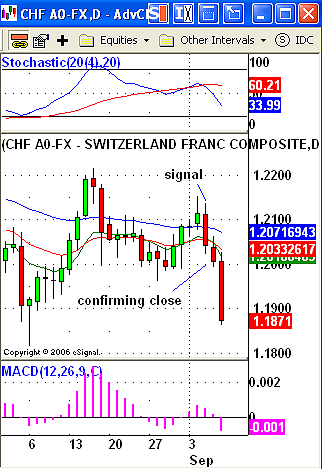
| We can see this happen in the US dollar/Swiss franc currency pair in the first half of September. This pair (USD/CHF) had rallied above the 50-day exponential moving average (EMA) in late August and managed to close at or above that level for three consecutive days. This opened up the possibility that the USD/CHF might regain the bullish momentum of the first half of August when the pair challenged the 1.2200 level. |
| Unfortunately for USD/CHF bulls ("Anyone? Bueller?"), the fourth day of the USD/CHF test of resistance at the 50-day EMA was the session at which the market opened at the same level as the previous day's close and closed several pips below the previous day's open. As such, a bearish engulfing candlestick line was formed. Not only that, but the bearish engulfing candlestick line closed back below the 50-day EMA. Trader Gary Smith once said of shorting stocks that the chart should "look bad. If it made a sound, it would sound like a broken leg." For me, that kind of break takes place when a market closes below the 50-day EMA. And in the context of the bearish engulfing candlestick, the potential for further downside seemed great. |

|
| FIGURE 1: US DOLLAR/SWISS FRANC, DAILY. A number of bearish signals — from a bearish engulfing candlestick to a break below the 50-day EMA to an mMm in the MACD histogram — anticipated an opportunity to the downside in the greenback/swissy in early September. |
| Graphic provided by: eSignal. |
| |
| There was yet another technical clue that supported the idea of lower prices for USD/CHF. Note in the lower panel in Figure 1 how the MACD histogram in early September began moving up, then reversed and moved down, forming a pattern that resembles the letters "mMm." This shorthand, borrowed from Alexander Elder (of Trading For A Living note), represents a potentially bearish pattern in the MACD histogram and can be used to spot short-term shifts in momentum. Here, the failure of the histogram to continue moving higher — and, instead, its movement lower — mirrored and confirmed the failure of the USD/CHF to continue moving higher after breaking out above the 50-day EMA. |
| The final ingredient is the confirming close. The market for USD/CHF signaled its next move on September 5 with the bearish engulfing, the breakdown below the 50-day EMA, and the completed mMm pattern in the MACD histogram. All that was required was a confirming close below the low of the session, September 5, when all these signals were created. That confirming close occurred on the following day, providing for a short entry at approximately 1.2005. Less than 24 hours later, as of this writing, USD/CHF is trading at 1.1870. |
Technical Writer for Technical Analysis of STOCKS & COMMODITIES magazine, Working-Money.com, and Traders.com Advantage.
| Title: | Technical Writer |
| Company: | Technical Analysis, Inc. |
| Address: | 4757 California Avenue SW |
| Seattle, WA 98116 | |
| Phone # for sales: | 206 938 0570 |
| Fax: | 206 938 1307 |
| Website: | www.Traders.com |
| E-mail address: | DPenn@traders.com |
Traders' Resource Links | |
| Charting the Stock Market: The Wyckoff Method -- Books | |
| Working-Money.com -- Online Trading Services | |
| Traders.com Advantage -- Online Trading Services | |
| Technical Analysis of Stocks & Commodities -- Publications and Newsletters | |
| Working Money, at Working-Money.com -- Publications and Newsletters | |
| Traders.com Advantage -- Publications and Newsletters | |
| Professional Traders Starter Kit -- Software | |
Click here for more information about our publications!
Comments

Request Information From Our Sponsors
- StockCharts.com, Inc.
- Candle Patterns
- Candlestick Charting Explained
- Intermarket Technical Analysis
- John Murphy on Chart Analysis
- John Murphy's Chart Pattern Recognition
- John Murphy's Market Message
- MurphyExplainsMarketAnalysis-Intermarket Analysis
- MurphyExplainsMarketAnalysis-Visual Analysis
- StockCharts.com
- Technical Analysis of the Financial Markets
- The Visual Investor
- VectorVest, Inc.
- Executive Premier Workshop
- One-Day Options Course
- OptionsPro
- Retirement Income Workshop
- Sure-Fire Trading Systems (VectorVest, Inc.)
- Trading as a Business Workshop
- VectorVest 7 EOD
- VectorVest 7 RealTime/IntraDay
- VectorVest AutoTester
- VectorVest Educational Services
- VectorVest OnLine
- VectorVest Options Analyzer
- VectorVest ProGraphics v6.0
- VectorVest ProTrader 7
- VectorVest RealTime Derby Tool
- VectorVest Simulator
- VectorVest Variator
- VectorVest Watchdog
