HOT TOPICS LIST
- MACD
- Fibonacci
- RSI
- Gann
- ADXR
- Stochastics
- Volume
- Triangles
- Futures
- Cycles
- Volatility
- ZIGZAG
- MESA
- Retracement
- Aroon
INDICATORS LIST
LIST OF TOPICS
PRINT THIS ARTICLE
by Chaitali Mohile
The intraday fall has retraced the Hong Kong iShares below resistance, leading to volatile sessions and a wide-range consolidation on the daily chart.
Position: N/A
Chaitali Mohile
Active trader in the Indian stock markets since 2003 and a full-time writer. Trading is largely based upon technical analysis.
PRINT THIS ARTICLE
VOLATILITY
HongKong iShares May Remain Choppy
09/06/07 10:55:18 AMby Chaitali Mohile
The intraday fall has retraced the Hong Kong iShares below resistance, leading to volatile sessions and a wide-range consolidation on the daily chart.
Position: N/A
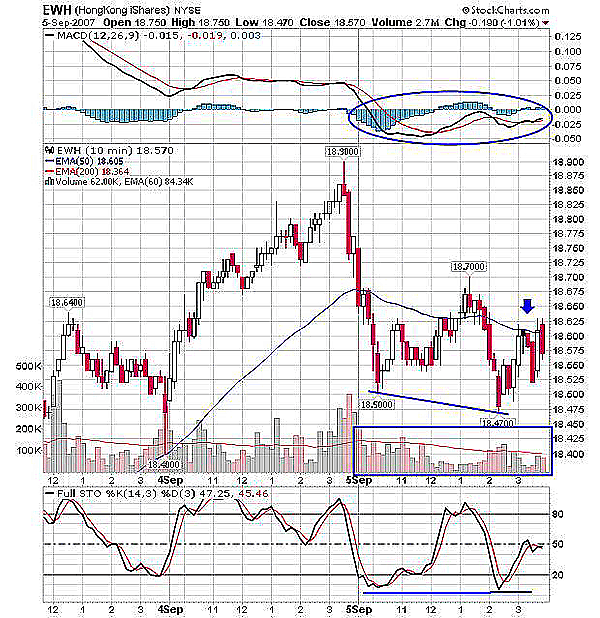
| The Hong Kong iShares (EWH) lost around 250 points in first half-hour of yesterday's trading. The opening at 18750 was supporting Tuesday's all-time high at 18900. This support barely held and the stock slipped below its 50-day exponential moving average (EMA). The newly formed resistance proved troublesome throughout the trading session. As the 10-minute chart below (see Figure 1) shows, a breakout above the 50 EMA was attempted but again was dragged down, forming a new intraday close at 18470. Above all, the last hour of trading was highly volatile compared to the overall day's move. The close congestion below the 50-day EMA indicates the strong desire to breakout of the resistance but it failed. |

|
| FIGURE 1: EWH, 10-MINUTE. HongKong iShares are under the 50-day EMA resistance. The indicators seen in the chart are not supporting the breakout. This may make the intraday session somewhat volatile. |
| Graphic provided by: StockCharts.com. |
| |
| The volatility on price charts reflects on indicators too. The moving average convergence/divergence (MACD) (12,26,9) shows very shaky movement. Under negative territory, the indicator went through bullish and bearish crossovers, and ultimately by end of day it rested on its trigger line. The stochastic (14,3,3) also made sharp lows as the price was dragged lower. The closing below 50 levels offers no clues as to where the stock will open in the following session. The fluctuations in volume show the trading psychology in the volatile market also; 18700 could be the first hurdle followed by 18900 (an all-time high) for the bullish rally. |
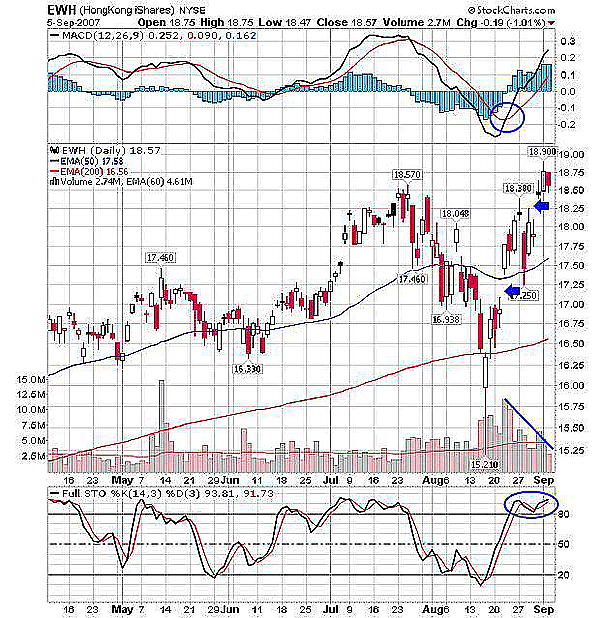
| The first gap up in mid-August crossed the 50-day EMA on encouraging volume to carry on the bullish rally. The rally moved higher with a newly formed support of the moving average and targeted the previous high resistance. Another gap up in early September moved ahead and made an all-time high at 18900. See Figure 2; the new high was not supported by huge volume, indicating lack of confidence amongst traders on the bullish rally. In addition, the stock consolidates after a long upward or downward rally. But in this picture, the strong intraday resistance has stopped the security from moving ahead, leading to a wide range bound movement. Apart from an all-time high, 18750-18500 was the intraday range, so the EWH is mostly likely to undergo this wide range bullish-bearish rally. |

|
| FIGURE 2: EWH, DAILY. The resistance on the intraday chart may lead to consolidation. |
| Graphic provided by: StockCharts.com. |
| |
| Meanwhile, the stochastic (14,3,3) is highly overbought at the 91 level. Though this oscillator can continue its overbought position for longer stretches, the price movement is likely to get affected. Traders can expect some nominal dip to create bullish space for the current rally. The MACD (12,26,9) has a bullish crossover and has remained positive surging above the zero line, therefore reflecting positive views on the rally. |
| EWH's daily chart in Figure 2 suggests bulls could rule, but the intraday volatile movement may lead to a wide-range consolidation till the lower level of 18500 is held strongly. |
Active trader in the Indian stock markets since 2003 and a full-time writer. Trading is largely based upon technical analysis.
| Company: | Independent |
| Address: | C1/3 Parth Indraprasth Towers. Vastrapur |
| Ahmedabad, Guj 380015 | |
| E-mail address: | chaitalimohile@yahoo.co.in |
Traders' Resource Links | |
| Independent has not added any product or service information to TRADERS' RESOURCE. | |
Click here for more information about our publications!
PRINT THIS ARTICLE

Request Information From Our Sponsors
- StockCharts.com, Inc.
- Candle Patterns
- Candlestick Charting Explained
- Intermarket Technical Analysis
- John Murphy on Chart Analysis
- John Murphy's Chart Pattern Recognition
- John Murphy's Market Message
- MurphyExplainsMarketAnalysis-Intermarket Analysis
- MurphyExplainsMarketAnalysis-Visual Analysis
- StockCharts.com
- Technical Analysis of the Financial Markets
- The Visual Investor
- VectorVest, Inc.
- Executive Premier Workshop
- One-Day Options Course
- OptionsPro
- Retirement Income Workshop
- Sure-Fire Trading Systems (VectorVest, Inc.)
- Trading as a Business Workshop
- VectorVest 7 EOD
- VectorVest 7 RealTime/IntraDay
- VectorVest AutoTester
- VectorVest Educational Services
- VectorVest OnLine
- VectorVest Options Analyzer
- VectorVest ProGraphics v6.0
- VectorVest ProTrader 7
- VectorVest RealTime Derby Tool
- VectorVest Simulator
- VectorVest Variator
- VectorVest Watchdog
