HOT TOPICS LIST
- MACD
- Fibonacci
- RSI
- Gann
- ADXR
- Stochastics
- Volume
- Triangles
- Futures
- Cycles
- Volatility
- ZIGZAG
- MESA
- Retracement
- Aroon
INDICATORS LIST
LIST OF TOPICS
PRINT THIS ARTICLE
by Chaitali Mohile
NASDAQ Composite surged on positive divergence in a bullish atmosphere in the market.
Position: Buy
Chaitali Mohile
Active trader in the Indian stock markets since 2003 and a full-time writer. Trading is largely based upon technical analysis.
PRINT THIS ARTICLE
BREAKOUTS
NASDAQ Composite Breaks Out
09/05/07 09:37:22 AMby Chaitali Mohile
NASDAQ Composite surged on positive divergence in a bullish atmosphere in the market.
Position: Buy
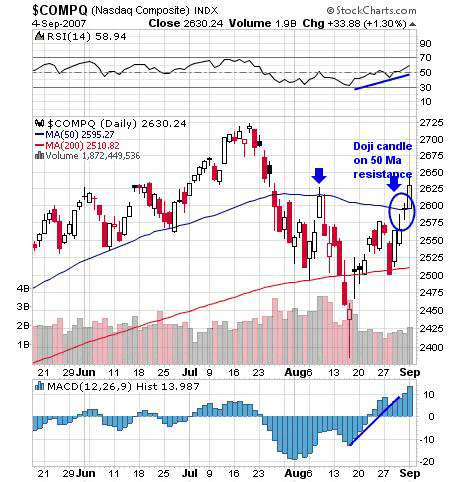
| Two moving averages kept the NASDAQ Composite ($COMPQ) in a wide range throughout August. The first breakout of the 50-day moving average (MA) resistance failed, resulting in a strong downfall, even below the 200-day moving average. However, the 200-day MA support was established immediately by a fast recovery in price with strong bullish indicators. The relative strength index (RSI)(14) held its 30-level support, even when the index moved below the 200-day MA, indicating a reduced bearish force. In addition, the histogram formed a higher low, reconfirming limited downside. These two bullish indications increased the volume, supporting the possibility of a bullish rally. |
| Now, the second breakout of the 50-day MA seemed uncertain as the doji candle was formed prominently on the resistance line. But by this time the buyers were already in with good volume, and the histogram has positive divergence, and the RSI (14) continued to remain above the 50 level (Figure 1). The histogram has moved above the zero line with new highs, while the price was stuck at the 50-day MA with a doji candle. Not only that, the RSI (14) has higher lows and higher highs, offering new buying opportunities. |

|
| FIGURE 1: $COMPQ, DAILY. The positive divergence on the histogram and the higher lows on the RSI (14) support the 50-day moving average breakout. The NASDAQ Composite index would soon reach its old high levels. |
| Graphic provided by: StockCharts.com. |
| |
| Tuesday's bullish session has closed below the day's high but has established strong support on the 50-day MA. The RSI (14) has moved vertically and indicates bullish strength in this new rally. In addition, the increase in volume would help to sustain the breakout. Thus, this breakout can be bought with previous highs as targets. |

|
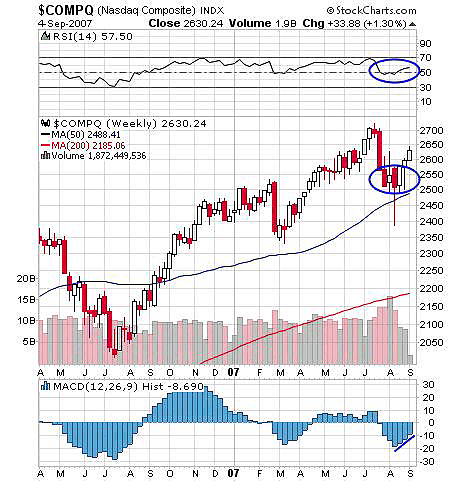
| FIGURE 2: $COMPQ, WEEKLY. The lower level consolidation accumulated the strength for a breakout. |
| Graphic provided by: StockCharts.com. |
| |
| The weekly chart (Figure 2) supports the breakout. The index has formed a strong bottom at the 2500 level above the 50-day moving average. The RSI (14) has moved steadily above the golden level of 50. The histogram though in negative territory has formed a higher low. So the indicators are bullish on a breakout rally. This medium-term chart also supports buying on a breakout rally. |
Active trader in the Indian stock markets since 2003 and a full-time writer. Trading is largely based upon technical analysis.
| Company: | Independent |
| Address: | C1/3 Parth Indraprasth Towers. Vastrapur |
| Ahmedabad, Guj 380015 | |
| E-mail address: | chaitalimohile@yahoo.co.in |
Traders' Resource Links | |
| Independent has not added any product or service information to TRADERS' RESOURCE. | |
Click here for more information about our publications!
PRINT THIS ARTICLE

Request Information From Our Sponsors
- VectorVest, Inc.
- Executive Premier Workshop
- One-Day Options Course
- OptionsPro
- Retirement Income Workshop
- Sure-Fire Trading Systems (VectorVest, Inc.)
- Trading as a Business Workshop
- VectorVest 7 EOD
- VectorVest 7 RealTime/IntraDay
- VectorVest AutoTester
- VectorVest Educational Services
- VectorVest OnLine
- VectorVest Options Analyzer
- VectorVest ProGraphics v6.0
- VectorVest ProTrader 7
- VectorVest RealTime Derby Tool
- VectorVest Simulator
- VectorVest Variator
- VectorVest Watchdog
- StockCharts.com, Inc.
- Candle Patterns
- Candlestick Charting Explained
- Intermarket Technical Analysis
- John Murphy on Chart Analysis
- John Murphy's Chart Pattern Recognition
- John Murphy's Market Message
- MurphyExplainsMarketAnalysis-Intermarket Analysis
- MurphyExplainsMarketAnalysis-Visual Analysis
- StockCharts.com
- Technical Analysis of the Financial Markets
- The Visual Investor
