HOT TOPICS LIST
- MACD
- Fibonacci
- RSI
- Gann
- ADXR
- Stochastics
- Volume
- Triangles
- Futures
- Cycles
- Volatility
- ZIGZAG
- MESA
- Retracement
- Aroon
INDICATORS LIST
LIST OF TOPICS
PRINT THIS ARTICLE
by Paolo Pezzutti
The stock is providing signs of a continuing rebound.
Position: Buy
Paolo Pezzutti
Author of the book "Trading the US Markets - A Comprehensive Guide to US Markets for International Traders and Investors" - Harriman House (July 2008)
PRINT THIS ARTICLE
TECHNICAL INDICATORS
Continental Airlines Rebounds Toward First Resistance
09/04/07 12:33:50 PMby Paolo Pezzutti
The stock is providing signs of a continuing rebound.
Position: Buy
| Prices jumped 5.63% on August 31, overperforming the AMEX Airline Index (XAL). In Figure 1, you can see that Continental Airlines (CAL) has been moving within a descending channel since January 2007. The fall of prices has been quite significant: the stock printed a the top on January 18 at $52.40 and the low on August 15 touched the $26.21 level. Basically, it is about 50%. What can we expect after this? After testing the lower part of the channel, prices are now moving to the upside toward the upper trendline. |

|
| FIGURE 1: CAL, DAILY. The stock has initiated a downtrend that led prices about 50% lower in eight months. Continental Airlines is moving within a descending channel. |
| Graphic provided by: TradeStation. |
| |
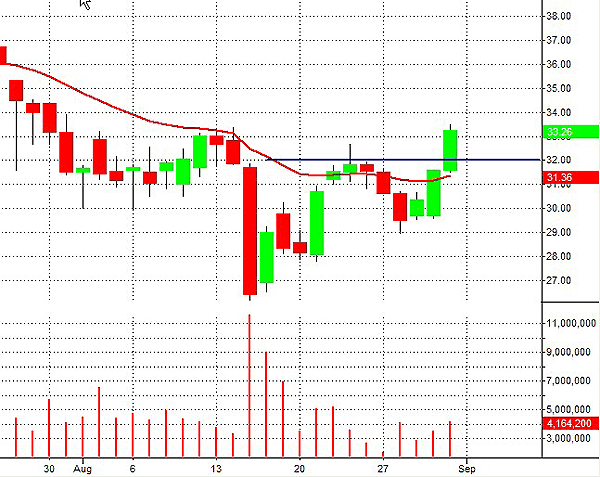
| On the daily chart in Figure 2, note how the stock has developed an Adam & Eve pattern. The formation is characterized by a deep bottom on high volume (Adam). Then the stock bounces and develops a gentler correction, printing a second bottom (Eve) on lower volatility. Eve's bottom takes longer to develop than the Adam spike, and it is characterized by lower volume, as you can see in the chart. Prices congest into a tight range and the stock then breaks to the upside. The top of Eve marks an excellent entry point when broken. On August 31, prices have broken the resistance level of $32, providing an entry signal, according to this pattern. |

|
| FIGURE 2: CAL, DAILY. The Adam & Eve pattern provides an indication of higher prices. Note the lower volume printed on August 28, compared to the volume printed on the selloff of August 15. |
| Graphic provided by: TradeStation. |
| |
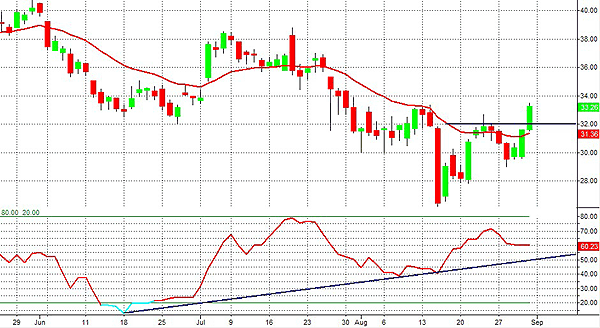
| In Figures 3 and 4, you can see some indicators that reinforce the view of a continuation of the up move toward the first resistance level at $35.50. In Figure 3, I have displayed the money flow indicator, which has printed a significant positive divergence in coincidence with the August 15th low. As you may know, this indicator is based on the calculation of the average price, using the average of the open, close, high, and low of a bar. Positive money flow is printed when the current bar's average price exceeds the previous bar's average price. It is calculated by multiplying the current bar's volume and its average price. The formula is: Money flow = 100 * Sum of positive money flow / Sum of all money flow The use of this indicator through the analysis of positive and negative divergences is quite popular. |

|
| FIGURE 3: CAL, DAILY. The money flow indicator has printed a significant positive divergence. |
| Graphic provided by: TradeStation. |
| |
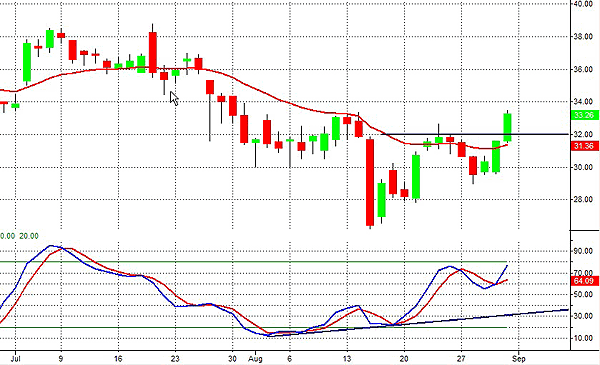
| In Figure 4, you can see that also the stochastic slow has developed a positive divergence and is now about to enter the overbought area. It may happen that divergences provide false signals, especially in coincidence with strong trends, but they can be a useful indication anyway of a possible change of trend, at least in the short term. |

|
| FIGURE 4: CAL, DAILY. In addition, the stochastic has developed a positive divergence. |
| Graphic provided by: TradeStation. |
| |
| The stock is moving in a medium-term downtrend and is currently printing a rebound, which could continue in the next session toward the first resistance levels at $35.50 and then possibly at $38 if the medium-term trend is interrupted. After eight months of downtrend and the sharp selloff in August, it is possible that we see a higher and longer rebound in this phase. When choosing your timing to entry a position, however, you should try and find a level where you have a good risk/reward ratio. The trade is risky and the stop-loss would be placed below $31.50 and $29. A failure of the Adam & Eve pattern would cause an acceleration of prices to the downside and the retest of the recent lows. |
Author of the book "Trading the US Markets - A Comprehensive Guide to US Markets for International Traders and Investors" - Harriman House (July 2008)
| Address: | VIA ROBERTO AGO 26 POSTAL CODE 00166 |
| Rome, ITALY | |
| Phone # for sales: | +393357540708 |
| E-mail address: | pezzutti.paolo@tiscali.it |
Click here for more information about our publications!
PRINT THIS ARTICLE

Request Information From Our Sponsors
- StockCharts.com, Inc.
- Candle Patterns
- Candlestick Charting Explained
- Intermarket Technical Analysis
- John Murphy on Chart Analysis
- John Murphy's Chart Pattern Recognition
- John Murphy's Market Message
- MurphyExplainsMarketAnalysis-Intermarket Analysis
- MurphyExplainsMarketAnalysis-Visual Analysis
- StockCharts.com
- Technical Analysis of the Financial Markets
- The Visual Investor
- VectorVest, Inc.
- Executive Premier Workshop
- One-Day Options Course
- OptionsPro
- Retirement Income Workshop
- Sure-Fire Trading Systems (VectorVest, Inc.)
- Trading as a Business Workshop
- VectorVest 7 EOD
- VectorVest 7 RealTime/IntraDay
- VectorVest AutoTester
- VectorVest Educational Services
- VectorVest OnLine
- VectorVest Options Analyzer
- VectorVest ProGraphics v6.0
- VectorVest ProTrader 7
- VectorVest RealTime Derby Tool
- VectorVest Simulator
- VectorVest Variator
- VectorVest Watchdog
