HOT TOPICS LIST
- MACD
- Fibonacci
- RSI
- Gann
- ADXR
- Stochastics
- Volume
- Triangles
- Futures
- Cycles
- Volatility
- ZIGZAG
- MESA
- Retracement
- Aroon
INDICATORS LIST
LIST OF TOPICS
PRINT THIS ARTICLE
by Chaitali Mohile
Home Depot has moved above some resistances, recovering from its previous losses on correction.
Position: Buy
Chaitali Mohile
Active trader in the Indian stock markets since 2003 and a full-time writer. Trading is largely based upon technical analysis.
PRINT THIS ARTICLE
RETRACEMENT
Home Depot On Fast Track
09/04/07 01:19:58 PMby Chaitali Mohile
Home Depot has moved above some resistances, recovering from its previous losses on correction.
Position: Buy
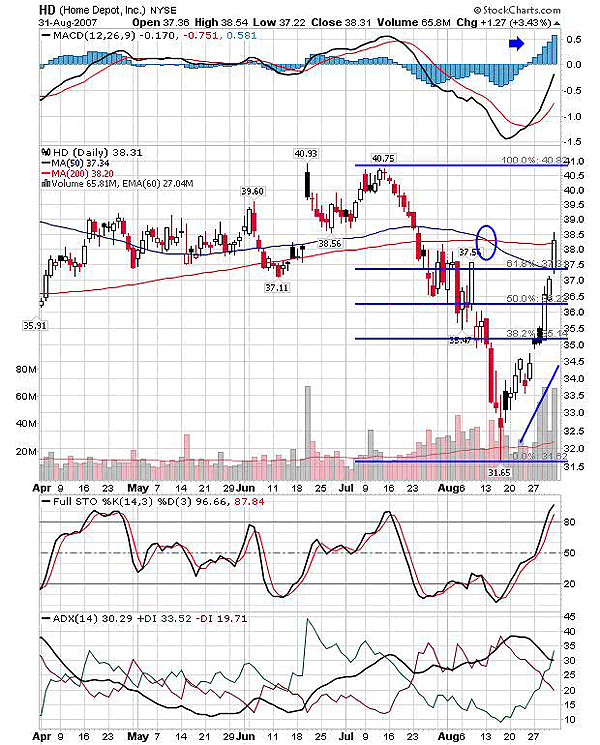
| Home Depot (HD) moved as low as 31.65, losing around $9 in the recent market correction. The double-top formations at the 41.93 level weaken the stock and the bulls too. Figure 1 shows the fast recovery of these losses from the 31.65 support level. The stock has pulled back to the 61% retracement levels and stands on 50-day moving average support, closing marginally above 200-day moving average (MA). The increase in volume supported the bullish pullback even under bearish crossover circumstances. The 50-day moving average very recently moved below the 200-day MA, generating the bearish conditions, but the price still moved ahead, neutralizing this bearish effect. The rally above $38.54 would lead to the previous highs of Home Depot. |

|
| FIGURE 1, HOME DEPOT, DAILY. After the correction, HD recovered to the 61% retracement level; $40.82 would be the next resistance level and the target for the long position would be above 38.54. |
| Graphic provided by: StockCharts.com. |
| |
| The stochastic can remain overbought for a longer duration. In Figure 1, the stochastic (14,3,3) is 87 -- that is, in overbought zone -- and has enough space for the bullish rally ahead. The moving average convergence/divergence (MACD)(12,26,9) is still in negative territory, whereas the histogram has moved above its zero line. So there is a mixed view on the MACD (12,26,9). The positive directional index (+DI) has moved above the negative directional index (-DI) and turned the trend with the bulls. Increasing buying pressure would strengthen the developed uptrend. So the breakout above 38.54 would be healthy going long on Home Depot Inc. |

|
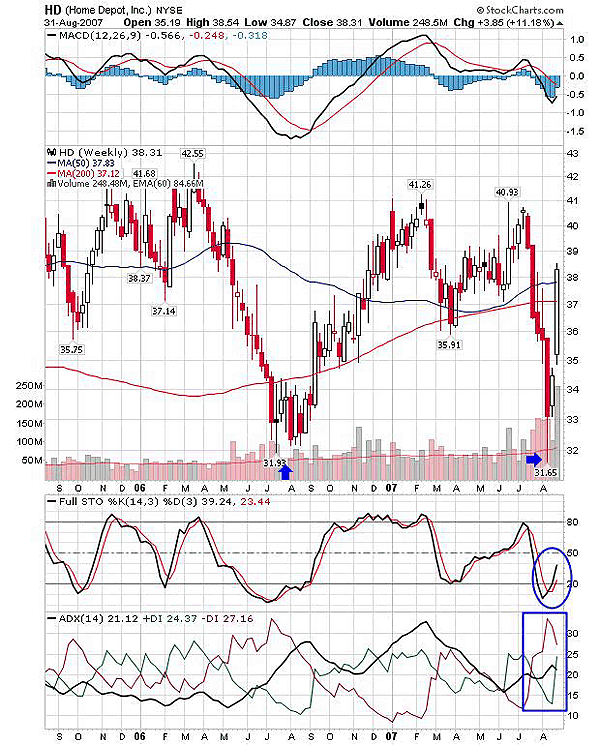
| FIGURE 2: HOME DEPOT, WEEKLY. The MACD (12,26,9) is the only indicator on this chart that would require bullish confirmation. |
| Graphic provided by: StockCharts.com. |
| |
| On the weekly chart in Figure 2, you can see that strong support is established at $31. Home Depot witnessed the fast recovery of losses. Apart from the MACD (12,26,9), the other two indicators are bullish. The stochastic (14,3,3) has opened a buying opportunity at the 23 level. The average directional movement index (ADX) (14) is indicating a developing uptrend, while +DI is tipped upward as -DI is ready to move downward. This means the volume would keep increasing. |
| The weekly and daily charts have a bullish force to keep Home Depot on the same fast track. The traders already long can keep a stop-loss of the $37.50 level. The 50-day MA and the 61% retracement level extends the same support level here ($37.50). But long positions should be looked at only above Friday's high. |
Active trader in the Indian stock markets since 2003 and a full-time writer. Trading is largely based upon technical analysis.
| Company: | Independent |
| Address: | C1/3 Parth Indraprasth Towers. Vastrapur |
| Ahmedabad, Guj 380015 | |
| E-mail address: | chaitalimohile@yahoo.co.in |
Traders' Resource Links | |
| Independent has not added any product or service information to TRADERS' RESOURCE. | |
Click here for more information about our publications!
PRINT THIS ARTICLE

Request Information From Our Sponsors
- VectorVest, Inc.
- Executive Premier Workshop
- One-Day Options Course
- OptionsPro
- Retirement Income Workshop
- Sure-Fire Trading Systems (VectorVest, Inc.)
- Trading as a Business Workshop
- VectorVest 7 EOD
- VectorVest 7 RealTime/IntraDay
- VectorVest AutoTester
- VectorVest Educational Services
- VectorVest OnLine
- VectorVest Options Analyzer
- VectorVest ProGraphics v6.0
- VectorVest ProTrader 7
- VectorVest RealTime Derby Tool
- VectorVest Simulator
- VectorVest Variator
- VectorVest Watchdog
- StockCharts.com, Inc.
- Candle Patterns
- Candlestick Charting Explained
- Intermarket Technical Analysis
- John Murphy on Chart Analysis
- John Murphy's Chart Pattern Recognition
- John Murphy's Market Message
- MurphyExplainsMarketAnalysis-Intermarket Analysis
- MurphyExplainsMarketAnalysis-Visual Analysis
- StockCharts.com
- Technical Analysis of the Financial Markets
- The Visual Investor
