HOT TOPICS LIST
- MACD
- Fibonacci
- RSI
- Gann
- ADXR
- Stochastics
- Volume
- Triangles
- Futures
- Cycles
- Volatility
- ZIGZAG
- MESA
- Retracement
- Aroon
INDICATORS LIST
LIST OF TOPICS
PRINT THIS ARTICLE
by Koos van der Merwe
The US market housing prices may be collapsing, but the Canadian REIT index looks far more encouraging.
Position: Buy
Koos van der Merwe
Has been a technical analyst since 1969, and has worked as a futures and options trader with First Financial Futures in Johannesburg, South Africa.
PRINT THIS ARTICLE
ELLIOTT WAVE
The Canadian REIT Index
09/04/07 12:00:00 PMby Koos van der Merwe
The US market housing prices may be collapsing, but the Canadian REIT index looks far more encouraging.
Position: Buy
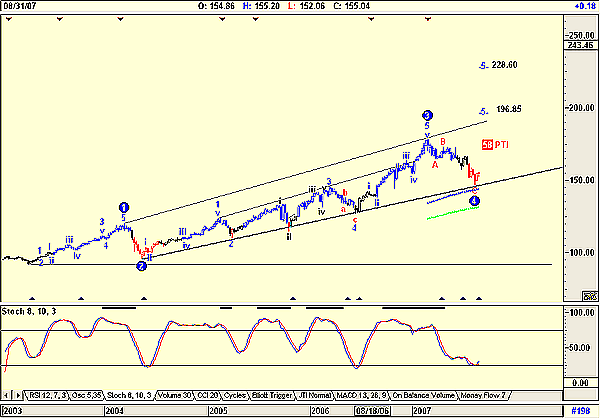
| The subprime mortgage crisis has caused US housing prices to fall dramatically. Although the Canadian market fell as the US markets fell, the Canadian REIT index looks as though it is a buy at present levels. Figure 1 is a weekly chart of the Canadian REIT index showing a classical Elliott wave count suggesting that there is a 58% probability of a future fifth-wave target of 196.85, with an outside probability of it reaching the 228.60 level. |

|
| FIGURE 1: CANADIAN REIT INDEX, WEEKLY. Here's a wave count of the Canadian REIT index. |
| Graphic provided by: AdvancedGET. |
| |
| Figure 1 follows the following wave rules: a. The wave count looks right -- the counts of waves, minimal waves, and subminimal waves all follow the correct counts. b. Where major wave 2 is a simple count, major wave 4 is a complicated count. c. Wave 4 appears to be complete as the chart appears to be correcting off a major support line. Finally, the stochastic 8-10-3 has given a buy signal. |

|
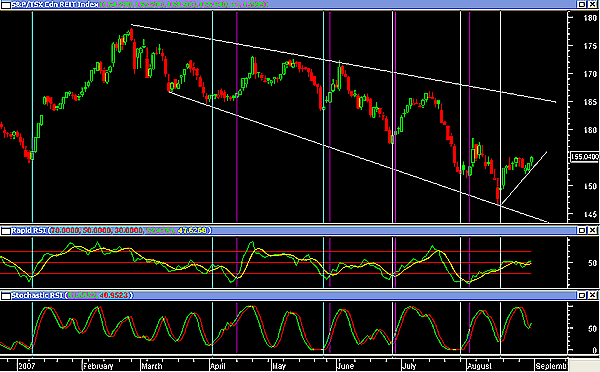
| FIGURE 2: CANADIAN REIT INDEX, DAILY. Here's a daily chart of the Canadian REIT index showing buy signals. |
| Graphic provided by: MetaStock. |
| |
| A look at Figure 2 confirms the buy signal. In this chart the two indicators I use are the stochastic relative strength index (RSI) and the rapid RSI. I will only acknowledge a buy signal from the stochastic RSI when a buy signal is given with the rapid RSI below the 50 level. I have shown stochastic RSI buy signals with vertical light blue lines, and rapid RSI signals with purple vertical lines. Note the accuracy of the signals. |
| The Canadian REIT index has given a buy signal, and as the American sub-prime crisis appears to be resolving itself with the help of President George Bush and Federal Reserve chairman Ben Bernanke, it is a signal worth taking advantage of. |
Has been a technical analyst since 1969, and has worked as a futures and options trader with First Financial Futures in Johannesburg, South Africa.
| Address: | 3256 West 24th Ave |
| Vancouver, BC | |
| Phone # for sales: | 6042634214 |
| E-mail address: | petroosp@gmail.com |
Click here for more information about our publications!
Comments
Date: 09/14/07Rank: 5Comment:

Request Information From Our Sponsors
- StockCharts.com, Inc.
- Candle Patterns
- Candlestick Charting Explained
- Intermarket Technical Analysis
- John Murphy on Chart Analysis
- John Murphy's Chart Pattern Recognition
- John Murphy's Market Message
- MurphyExplainsMarketAnalysis-Intermarket Analysis
- MurphyExplainsMarketAnalysis-Visual Analysis
- StockCharts.com
- Technical Analysis of the Financial Markets
- The Visual Investor
- VectorVest, Inc.
- Executive Premier Workshop
- One-Day Options Course
- OptionsPro
- Retirement Income Workshop
- Sure-Fire Trading Systems (VectorVest, Inc.)
- Trading as a Business Workshop
- VectorVest 7 EOD
- VectorVest 7 RealTime/IntraDay
- VectorVest AutoTester
- VectorVest Educational Services
- VectorVest OnLine
- VectorVest Options Analyzer
- VectorVest ProGraphics v6.0
- VectorVest ProTrader 7
- VectorVest RealTime Derby Tool
- VectorVest Simulator
- VectorVest Variator
- VectorVest Watchdog
