HOT TOPICS LIST
- MACD
- Fibonacci
- RSI
- Gann
- ADXR
- Stochastics
- Volume
- Triangles
- Futures
- Cycles
- Volatility
- ZIGZAG
- MESA
- Retracement
- Aroon
INDICATORS LIST
LIST OF TOPICS
PRINT THIS ARTICLE
by Arthur Hill
Taser formed a nice falling flag that returned to broken resistance, and the stock is showing early signs of buying pressure.
Position: Buy
Arthur Hill
Arthur Hill is currently editor of TDTrader.com, a website specializing in trading strategies, sector/industry specific breadth stats and overall technical analysis. He passed the Society of Technical Analysts (STA London) diploma exam with distinction is a Certified Financial Technician (CFTe). Prior to TD Trader, he was the Chief Technical Analyst for Stockcharts.com and the main contributor to the ChartSchool.
PRINT THIS ARTICLE
POINT & FIGURE
Taser Forms Falling Flag Correction
08/31/07 11:31:13 AMby Arthur Hill
Taser formed a nice falling flag that returned to broken resistance, and the stock is showing early signs of buying pressure.
Position: Buy
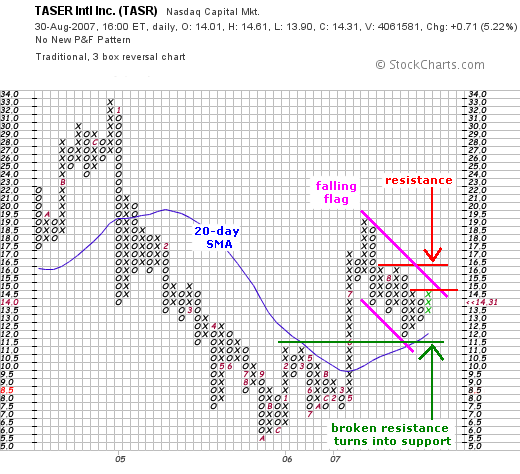
| Figure 1 is a point & figure chart that extends back to October 2005. Point & figure charts have a habit of condensing price action, and this allows for a longer-term view of price action. The stock declined throughout 2005, firmed in 2006, and broke resistance with a surge in 2007 (May–July 2007, to be exact). This breakout was bullish and the stock corrected back to broken resistance over the last few weeks. |

|
| FIGURE 1: TASER, POINT & FIGURE. This P&F chart extends back to October 2005, firming in 2006 and broke resistance with a surge in 2007. |
| Graphic provided by: StockCharts.com. |
| |
| The correction formed a falling flag on the point & figure chart and the stock remains below the upper trendline. A move above 15.5 would break this trendline, and this would be the first bullish signal. Note that the upper trendline was drawn as a bearish resistance line that follows the grid. The second resistance point is at 16.5, and a break above this level would complete the trend reversal. |
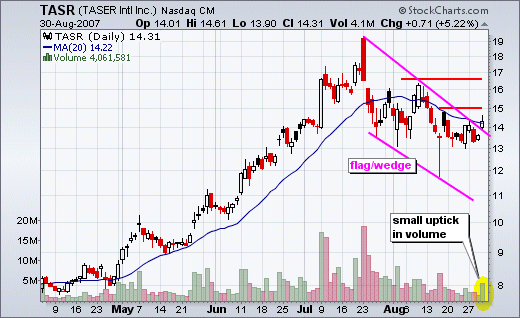
| For a different perspective, I am also showing the daily candlestick chart (Figure 2). The chart only goes back to late April and we cannot even see 2006 resistance. The correction over the last few weeks still looks like a falling flag or perhaps even a wedge. The stock broke above the upper trendline with a gap up on Thursday and this is quite positive. Further strength above 15 would be bullish, and I would then expect another resistance challenge around 19. |

|
| FIGURE 2: TASER, DAILY. The stock broke above the upper trendline with a gap up. |
| Graphic provided by: StockCharts.com. |
| |
| In addition to the gap and trendline break, volume is starting to pick up. The stock declined on heavy volume in July and then settled over the last few weeks. Volume has been low in August and below four million shares the last nine days. Yesterday's volume hit 4.1 million, and bullish interest is picking up during the dog days of summer. |
Arthur Hill is currently editor of TDTrader.com, a website specializing in trading strategies, sector/industry specific breadth stats and overall technical analysis. He passed the Society of Technical Analysts (STA London) diploma exam with distinction is a Certified Financial Technician (CFTe). Prior to TD Trader, he was the Chief Technical Analyst for Stockcharts.com and the main contributor to the ChartSchool.
| Title: | Editor |
| Company: | TDTrader.com |
| Address: | Willem Geetsstraat 17 |
| Mechelen, B2800 | |
| Phone # for sales: | 3215345465 |
| Website: | www.tdtrader.com |
| E-mail address: | arthurh@tdtrader.com |
Traders' Resource Links | |
| TDTrader.com has not added any product or service information to TRADERS' RESOURCE. | |
Click here for more information about our publications!
Comments
Date: 04/29/08Rank: 5Comment:

Request Information From Our Sponsors
- VectorVest, Inc.
- Executive Premier Workshop
- One-Day Options Course
- OptionsPro
- Retirement Income Workshop
- Sure-Fire Trading Systems (VectorVest, Inc.)
- Trading as a Business Workshop
- VectorVest 7 EOD
- VectorVest 7 RealTime/IntraDay
- VectorVest AutoTester
- VectorVest Educational Services
- VectorVest OnLine
- VectorVest Options Analyzer
- VectorVest ProGraphics v6.0
- VectorVest ProTrader 7
- VectorVest RealTime Derby Tool
- VectorVest Simulator
- VectorVest Variator
- VectorVest Watchdog
- StockCharts.com, Inc.
- Candle Patterns
- Candlestick Charting Explained
- Intermarket Technical Analysis
- John Murphy on Chart Analysis
- John Murphy's Chart Pattern Recognition
- John Murphy's Market Message
- MurphyExplainsMarketAnalysis-Intermarket Analysis
- MurphyExplainsMarketAnalysis-Visual Analysis
- StockCharts.com
- Technical Analysis of the Financial Markets
- The Visual Investor
