HOT TOPICS LIST
- MACD
- Fibonacci
- RSI
- Gann
- ADXR
- Stochastics
- Volume
- Triangles
- Futures
- Cycles
- Volatility
- ZIGZAG
- MESA
- Retracement
- Aroon
INDICATORS LIST
LIST OF TOPICS
PRINT THIS ARTICLE
by Chaitali Mohile
The Dow Jones Utility Average has more than one bearish indication.
Position: N/A
Chaitali Mohile
Active trader in the Indian stock markets since 2003 and a full-time writer. Trading is largely based upon technical analysis.
PRINT THIS ARTICLE
CHART ANALYSIS
Dow Jones Utility Highly Bearish
08/29/07 11:10:48 AMby Chaitali Mohile
The Dow Jones Utility Average has more than one bearish indication.
Position: N/A
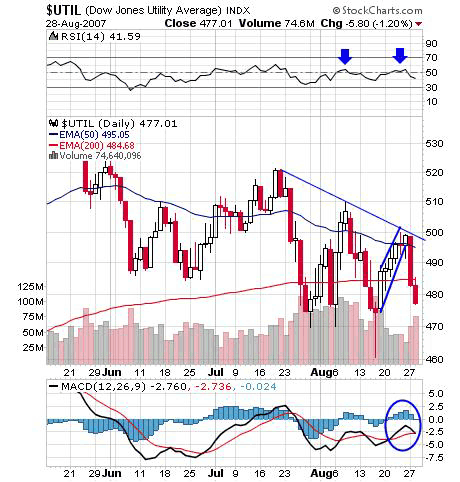
| The rising wedge, lower highs, short- and long-term moving average resistance, and bearish momentum indicators are footmarks of bears prevailing in the market. And the utility index has these marks on its daily chart (Figure 1). The index formed lower highs during its pullback rally instead of moving closer to its previous high at 520. The lower highs indicate the lack of bullish strength to violate the resistance and losing confidence. In addition, the index failed to establish strong support on the 50-day exponential moving average (a short-term moving average) and the 200-day EMA (long-term moving average) turned from resistance to support. |
| The second pullback from 470 to 500 began on heavy volume and crossed the 200-day EMA resistance at first. But till the 50-day EMA resistance took off, the volume reduced dramatically. This pullback rally formed a rising wedge and also faced the resistance of the 50-day EMA. With these two strongly bearish indications, the utility average took a nose-dive and lost the 200-day EMA support too. The trading session on August 28 opened under the 200-day EMA resistance, losing around 1% more. |

|
| FIGURE 1: DOW JONES UTILITY INDEX, DAILY. The trendline is joining lower highs, a rising wedge, the 50-day EMA, and the 200-day EMA; in addition, the 50-level resistance in the RSI (14) and volatile MACD (12,26,9) can be seen in the Dow Jones Utility Average. |
| Graphic provided by: StockCharts.com. |
| |
| The rising wedge breakdown levels are calculated by subtracting the length of the wedge from the breakdown level. In Figure 1, the rising wedge has almost achieved its target, so on this ground if we expect a moderate bullish rally, the 200-day EMA stands like a mountain. Let's see what the indicators suggest. The relative strength index (RSI)(14) corrected back from 50-level resistance. The breakout on the indicator failed twice, indicating a bearish force on the rally. Though currently, the RSI (14) is above 30, it does not indicate any trade but highlights its bullish failure. The moving average convergence/divergence (MACD)(12,26,9) shows very volatile moves. It failed to sustain a bullish as well as bearish crossover. The histogram also indicates tired bulls, so traders need to be watchful of the MACD (12,26, 9) signals. |
| Thus, there is the lesser possibility of a bullish rally on the utility index. In fact, with the 200-day EMA resistance and volatile RSI (14), and MACD (12,26,9), I expect the index to test its low pivot at 470-65 before running a bullish rally. There is no specific short or long trade on the index; traders are requested to stay alert on either side. |
Active trader in the Indian stock markets since 2003 and a full-time writer. Trading is largely based upon technical analysis.
| Company: | Independent |
| Address: | C1/3 Parth Indraprasth Towers. Vastrapur |
| Ahmedabad, Guj 380015 | |
| E-mail address: | chaitalimohile@yahoo.co.in |
Traders' Resource Links | |
| Independent has not added any product or service information to TRADERS' RESOURCE. | |
Click here for more information about our publications!
PRINT THIS ARTICLE

Request Information From Our Sponsors
- VectorVest, Inc.
- Executive Premier Workshop
- One-Day Options Course
- OptionsPro
- Retirement Income Workshop
- Sure-Fire Trading Systems (VectorVest, Inc.)
- Trading as a Business Workshop
- VectorVest 7 EOD
- VectorVest 7 RealTime/IntraDay
- VectorVest AutoTester
- VectorVest Educational Services
- VectorVest OnLine
- VectorVest Options Analyzer
- VectorVest ProGraphics v6.0
- VectorVest ProTrader 7
- VectorVest RealTime Derby Tool
- VectorVest Simulator
- VectorVest Variator
- VectorVest Watchdog
- StockCharts.com, Inc.
- Candle Patterns
- Candlestick Charting Explained
- Intermarket Technical Analysis
- John Murphy on Chart Analysis
- John Murphy's Chart Pattern Recognition
- John Murphy's Market Message
- MurphyExplainsMarketAnalysis-Intermarket Analysis
- MurphyExplainsMarketAnalysis-Visual Analysis
- StockCharts.com
- Technical Analysis of the Financial Markets
- The Visual Investor
