HOT TOPICS LIST
- MACD
- Fibonacci
- RSI
- Gann
- ADXR
- Stochastics
- Volume
- Triangles
- Futures
- Cycles
- Volatility
- ZIGZAG
- MESA
- Retracement
- Aroon
INDICATORS LIST
LIST OF TOPICS
PRINT THIS ARTICLE
by Arthur Hill
A confirmed head & shoulders top and relative weakness point to lower prices for Ford Motor Co.
Position: Sell
Arthur Hill
Arthur Hill is currently editor of TDTrader.com, a website specializing in trading strategies, sector/industry specific breadth stats and overall technical analysis. He passed the Society of Technical Analysts (STA London) diploma exam with distinction is a Certified Financial Technician (CFTe). Prior to TD Trader, he was the Chief Technical Analyst for Stockcharts.com and the main contributor to the ChartSchool.
PRINT THIS ARTICLE
HEAD & SHOULDERS
Ford Leads Market Lower
08/29/07 09:34:56 AMby Arthur Hill
A confirmed head & shoulders top and relative weakness point to lower prices for Ford Motor Co.
Position: Sell
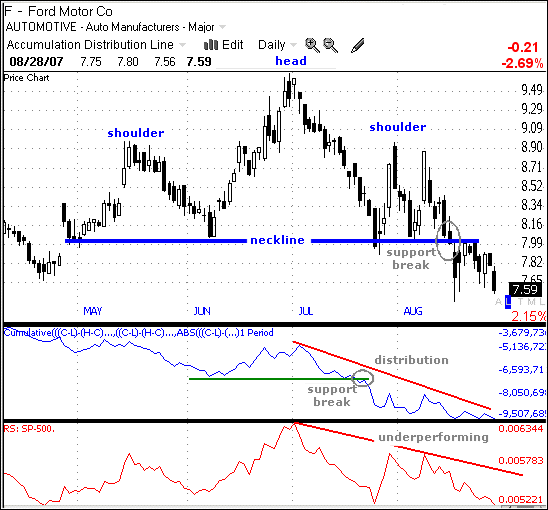
| On the daily chart, Ford (F) traced out a head & shoulders pattern from May to August (Figure 1). The left shoulder formed in May, the head in late June, and the right shoulder formed in July–August. Neckline support was set at 8 and the stock broke support with a sharp decline in mid-August. The neckline break confirms the bearish reversal pattern and targets further weakness toward 6.5. The length of the pattern (head to neckline) is subtracted from the neckline for a downside target (9.6 - 8 = 1.6, 8 - 1.6 = 6.4). |

|
| FIGURE 1: FORD, DAILY. F traced out a head & shoulders pattern from May to August. |
| Graphic provided by: Telechart 2007. |
| |
| The accumulation-distribution line and price relative confirm weakness and point to a new downtrend. The accumulation-distribution line broke support in July and led the way lower over the next six weeks. There is nothing but selling pressure present in this stock. The price relative compares the performance of Ford with the Standard & Poor's 500. Ford stock outperformed in June but fell apart in July, and the price relative moved to a new low in August. Ford is leading the market lower and this is bearish for the stock. |

|
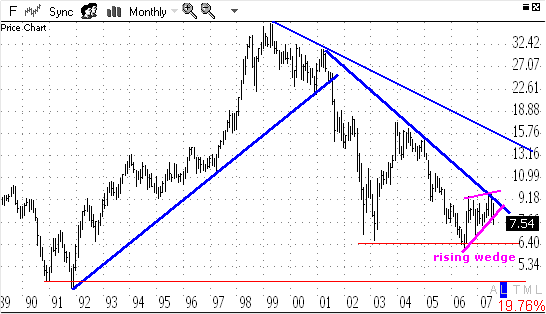
| FIGURE 2: FORD, MONTHLY. This chart shows that F has been trending lower since 1999. |
| Graphic provided by: Telechart 2007. |
| |
| While the head & shoulders target looks viable, I would also like to check out a long-term chart to confirm downside projections. The monthly chart extends back to 1989 and Ford has support around 6.40 from the 2003 and 2006 lows (Figure 2). However, the stock peaked in 1999 and has been trending lower since (over seven years). Therefore, a test of the 90–91 lows is certainly possible and the stock could fall all the way to 5. In fact, I can also make out a rising wedge from July 2006 to July 2007 (magenta trendlines), and the breakdown signals a continuation of the prior decline. |
Arthur Hill is currently editor of TDTrader.com, a website specializing in trading strategies, sector/industry specific breadth stats and overall technical analysis. He passed the Society of Technical Analysts (STA London) diploma exam with distinction is a Certified Financial Technician (CFTe). Prior to TD Trader, he was the Chief Technical Analyst for Stockcharts.com and the main contributor to the ChartSchool.
| Title: | Editor |
| Company: | TDTrader.com |
| Address: | Willem Geetsstraat 17 |
| Mechelen, B2800 | |
| Phone # for sales: | 3215345465 |
| Website: | www.tdtrader.com |
| E-mail address: | arthurh@tdtrader.com |
Traders' Resource Links | |
| TDTrader.com has not added any product or service information to TRADERS' RESOURCE. | |
Click here for more information about our publications!
PRINT THIS ARTICLE

Request Information From Our Sponsors
- StockCharts.com, Inc.
- Candle Patterns
- Candlestick Charting Explained
- Intermarket Technical Analysis
- John Murphy on Chart Analysis
- John Murphy's Chart Pattern Recognition
- John Murphy's Market Message
- MurphyExplainsMarketAnalysis-Intermarket Analysis
- MurphyExplainsMarketAnalysis-Visual Analysis
- StockCharts.com
- Technical Analysis of the Financial Markets
- The Visual Investor
- VectorVest, Inc.
- Executive Premier Workshop
- One-Day Options Course
- OptionsPro
- Retirement Income Workshop
- Sure-Fire Trading Systems (VectorVest, Inc.)
- Trading as a Business Workshop
- VectorVest 7 EOD
- VectorVest 7 RealTime/IntraDay
- VectorVest AutoTester
- VectorVest Educational Services
- VectorVest OnLine
- VectorVest Options Analyzer
- VectorVest ProGraphics v6.0
- VectorVest ProTrader 7
- VectorVest RealTime Derby Tool
- VectorVest Simulator
- VectorVest Variator
- VectorVest Watchdog
