

HOT TOPICS LIST
- MACD
- Fibonacci
- RSI
- Gann
- ADXR
- Stochastics
- Volume
- Triangles
- Futures
- Cycles
- Volatility
- ZIGZAG
- MESA
- Retracement
- Aroon
INDICATORS LIST
LIST OF TOPICS
PRINT THIS ARTICLE
by Arthur Hill
After breaking key support in July, the Finance SPDR turned downright violent in August, but that was not enough to undo the technical damage.
Position: Sell
Arthur Hill
Arthur Hill is currently editor of TDTrader.com, a website specializing in trading strategies, sector/industry specific breadth stats and overall technical analysis. He passed the Society of Technical Analysts (STA London) diploma exam with distinction is a Certified Financial Technician (CFTe). Prior to TD Trader, he was the Chief Technical Analyst for Stockcharts.com and the main contributor to the ChartSchool.
PRINT THIS ARTICLE
DOUBLE TOPS
XLF Turns Violent
08/28/07 03:34:33 PMby Arthur Hill
After breaking key support in July, the Finance SPDR turned downright violent in August, but that was not enough to undo the technical damage.
Position: Sell
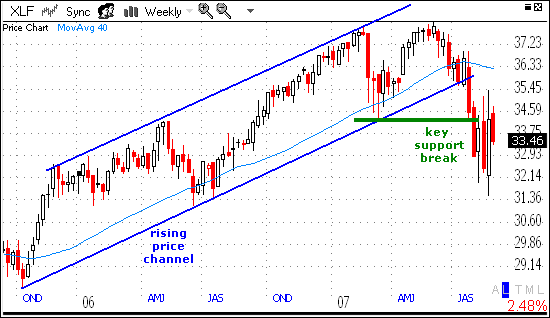
| First, let's take a look at the weekly chart and review the technical breakdown (Figure 1). The Finance SPDR (XLF) formed a large double top in the first half of 2007 and broke double-top support with a move below the March low. This is a major reversal pattern and the downside target is to around 30. The length of the pattern (~4) is subtracted from the support break (34) to obtain a target. In addition to this break, the exchange traded fund (ETF) also broke rising channel support and exceeded the 40-week simple moving average. |
|
| FIGURE 1: XLF, WEEKLY. The Finance SPDR formed a large double top in the first half of 2007 and broke double-top support with a move below the March low. |
| Graphic provided by: Telechart 2007. |
| |
| Trading turned mighty violent after this support break, but this was not enough to undo the damage. The ETF forged a lower low, and this constitutes the start of a downtrend. There were a number of forays back above the support break, but the majority of trading has been below support. This wild range is simply a consolidation after the breakdown, and there is likely to be another leg down. |
|
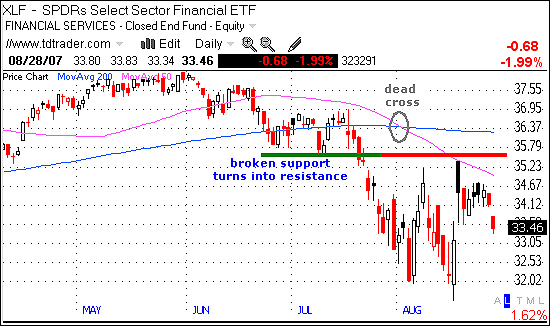
| FIGURE 2: XLF, DAILY. Resistance was confirmed around 35.5, and this is the level to beat. |
| Graphic provided by: Telechart 2007. |
| |
| The daily chart (Figure 2) confirms resistance around 35.5 and this is the level to beat. First, broken support at 35.5 turns into resistance. Second, the ETF surged and failed to break above broken support twice in August. Third, the falling 50-day moving average marks resistance around this level. In addition, notice that the 50-day moved below the 200-day for a dead cross, which is bearish. The bulls are going to need a lot of firepower to get through this level. |
| The odds favor further weakness, with the double top confirmed on the weekly chart and the ETF hitting resistance on the daily chart. There is support around 32 from the August lows and a break below these lows would signal a continuation of the prior decline. The next downside target would be the double projection around 30, and there is also support around 29 from the October lows. |
Arthur Hill is currently editor of TDTrader.com, a website specializing in trading strategies, sector/industry specific breadth stats and overall technical analysis. He passed the Society of Technical Analysts (STA London) diploma exam with distinction is a Certified Financial Technician (CFTe). Prior to TD Trader, he was the Chief Technical Analyst for Stockcharts.com and the main contributor to the ChartSchool.
| Title: | Editor |
| Company: | TDTrader.com |
| Address: | Willem Geetsstraat 17 |
| Mechelen, B2800 | |
| Phone # for sales: | 3215345465 |
| Website: | www.tdtrader.com |
| E-mail address: | arthurh@tdtrader.com |
Traders' Resource Links | |
| TDTrader.com has not added any product or service information to TRADERS' RESOURCE. | |
Click here for more information about our publications!
PRINT THIS ARTICLE

Request Information From Our Sponsors
- StockCharts.com, Inc.
- Candle Patterns
- Candlestick Charting Explained
- Intermarket Technical Analysis
- John Murphy on Chart Analysis
- John Murphy's Chart Pattern Recognition
- John Murphy's Market Message
- MurphyExplainsMarketAnalysis-Intermarket Analysis
- MurphyExplainsMarketAnalysis-Visual Analysis
- StockCharts.com
- Technical Analysis of the Financial Markets
- The Visual Investor
- VectorVest, Inc.
- Executive Premier Workshop
- One-Day Options Course
- OptionsPro
- Retirement Income Workshop
- Sure-Fire Trading Systems (VectorVest, Inc.)
- Trading as a Business Workshop
- VectorVest 7 EOD
- VectorVest 7 RealTime/IntraDay
- VectorVest AutoTester
- VectorVest Educational Services
- VectorVest OnLine
- VectorVest Options Analyzer
- VectorVest ProGraphics v6.0
- VectorVest ProTrader 7
- VectorVest RealTime Derby Tool
- VectorVest Simulator
- VectorVest Variator
- VectorVest Watchdog