HOT TOPICS LIST
- MACD
- Fibonacci
- RSI
- Gann
- ADXR
- Stochastics
- Volume
- Triangles
- Futures
- Cycles
- Volatility
- ZIGZAG
- MESA
- Retracement
- Aroon
INDICATORS LIST
LIST OF TOPICS
PRINT THIS ARTICLE
by David Penn
Negative divergences develop as the 10-year Treasury nears contract highs.
Position: N/A
David Penn
Technical Writer for Technical Analysis of STOCKS & COMMODITIES magazine, Working-Money.com, and Traders.com Advantage.
PRINT THIS ARTICLE
SUPPORT & RESISTANCE
December Bonds Drive Into Resistance
08/28/07 09:28:12 AMby David Penn
Negative divergences develop as the 10-year Treasury nears contract highs.
Position: N/A
| Late in July, I wrote about the reversal patterns — including "dark cloud cover" — that were appearing in the charts of the September 10-year Treasury bond futures contract ("Dark Cloud Cover Caps Bond Rally," July 30, 2007). "Dark cloud cover" is a Japanese candlestick pattern that develops during uptrends and signals waning momentum to the upside (Figure 1). After a series of rising candlestick lines, a market will open up but close down, so far down in fact that it penetrates 50% or more of the real body of the previous candlestick line. That phenomenon is called "dark cloud cover." |
| At least initially, dark cloud cover is more a warning to bulls than it is an opportunity for the bears. All the dark cloud cover pattern reflects is simply waning bullish momentum. Only when the market actually reverses by closing below the low of both the dark cloud cover session and the session that is being "covered" can traders consider the dark cloud cover pattern confirmed as a reversal pattern and suitable for trading to the short side. |

|
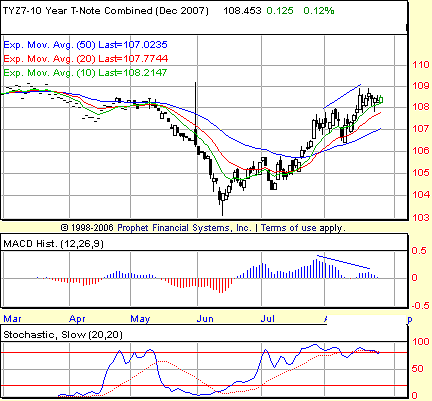
| FIGURE 1: 10-YEAR TREASURY NOTE, DECEMBER FUTURES, DAILY. Negative divergences in both the MACD histogram and the stochastic serve as a warning of waning momentum to the upside just as December T-note futures test resistance at the March highs. |
| Graphic provided by: Prophet Financial, Inc. |
| |
| This rule, unfortunately, would not have kept traders out of the clearest, dark cloud cover short trade in September T-note futures, the dark cloud cover of August 6 that was confirmed as shortable on August 8. September futures reacted strongly to the market's test of the 50-day exponential moving average (EMA), with buyers stepping in to bid prices higher and turning a dark cloud cover short into a pivot low at support. The move from that test of support brought September T-note futures from just above 107 to more than 109 in less than 10 days. |
| The advance in bonds, however, has brought that market right up to what appears to be a significant resistance level at 109. This potential resistance level coincides with the March 2007 highs in T-note futures and, understandably, the market has started showing the sort of fatigue that often accompanies tests of new highs. In particular, while the market for T-note futures remains overbought (basis December), reflecting an abundance of buying interest, the market has begun to develop negative divergences in both the MACD histogram and the stochastic. |
| As was the case with the candlestick reversal patterns, divergences serve first as a warning to those who were following the trend that the divergence appears to challenge. So again, these divergences are foremost a warning to T-note bulls to reduce their exposure to the market. However, should the market in fact reverse and close lower, particularly below 107.75 or so, then T-note bears may once again have an opportunity to make reasonable bets that bonds will be priced lower in the near term. |
Technical Writer for Technical Analysis of STOCKS & COMMODITIES magazine, Working-Money.com, and Traders.com Advantage.
| Title: | Technical Writer |
| Company: | Technical Analysis, Inc. |
| Address: | 4757 California Avenue SW |
| Seattle, WA 98116 | |
| Phone # for sales: | 206 938 0570 |
| Fax: | 206 938 1307 |
| Website: | www.Traders.com |
| E-mail address: | DPenn@traders.com |
Traders' Resource Links | |
| Charting the Stock Market: The Wyckoff Method -- Books | |
| Working-Money.com -- Online Trading Services | |
| Traders.com Advantage -- Online Trading Services | |
| Technical Analysis of Stocks & Commodities -- Publications and Newsletters | |
| Working Money, at Working-Money.com -- Publications and Newsletters | |
| Traders.com Advantage -- Publications and Newsletters | |
| Professional Traders Starter Kit -- Software | |
Click here for more information about our publications!
PRINT THIS ARTICLE

Request Information From Our Sponsors
- StockCharts.com, Inc.
- Candle Patterns
- Candlestick Charting Explained
- Intermarket Technical Analysis
- John Murphy on Chart Analysis
- John Murphy's Chart Pattern Recognition
- John Murphy's Market Message
- MurphyExplainsMarketAnalysis-Intermarket Analysis
- MurphyExplainsMarketAnalysis-Visual Analysis
- StockCharts.com
- Technical Analysis of the Financial Markets
- The Visual Investor
- VectorVest, Inc.
- Executive Premier Workshop
- One-Day Options Course
- OptionsPro
- Retirement Income Workshop
- Sure-Fire Trading Systems (VectorVest, Inc.)
- Trading as a Business Workshop
- VectorVest 7 EOD
- VectorVest 7 RealTime/IntraDay
- VectorVest AutoTester
- VectorVest Educational Services
- VectorVest OnLine
- VectorVest Options Analyzer
- VectorVest ProGraphics v6.0
- VectorVest ProTrader 7
- VectorVest RealTime Derby Tool
- VectorVest Simulator
- VectorVest Variator
- VectorVest Watchdog
