HOT TOPICS LIST
- MACD
- Fibonacci
- RSI
- Gann
- ADXR
- Stochastics
- Volume
- Triangles
- Futures
- Cycles
- Volatility
- ZIGZAG
- MESA
- Retracement
- Aroon
INDICATORS LIST
LIST OF TOPICS
PRINT THIS ARTICLE
by Chaitali Mohile
The Computer Technology Index surged above resistance, targeting its old highs.
Position: Buy
Chaitali Mohile
Active trader in the Indian stock markets since 2003 and a full-time writer. Trading is largely based upon technical analysis.
PRINT THIS ARTICLE
BREAKOUTS
Breakout In Computer Technology Index
08/28/07 01:52:49 PMby Chaitali Mohile
The Computer Technology Index surged above resistance, targeting its old highs.
Position: Buy
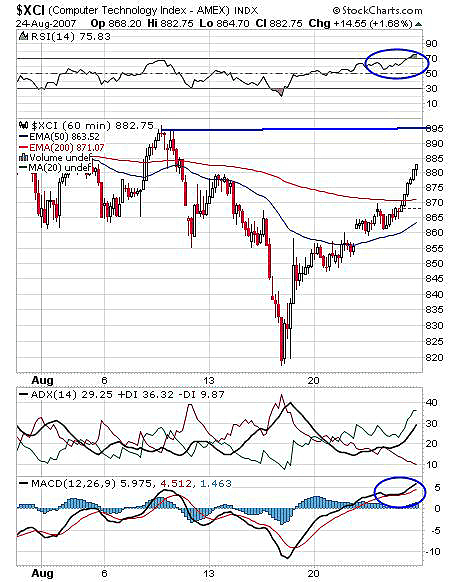
| The Computer Technology Index ($XCI) has been underperforming the last three to four years. Since mid-2006, some slow recovery has been seen, offering some trading opportunities in the short term. The index follows along with the pullback rally in the entire market. $XCI made a high of 925 before the plummet in financial markets on credit issues. Now, the index has turned positive on a short-term basis. The hourly chart (Figure 1) has already moved ahead of the 200-day exponential moving average (EMA) with the bullish support of indicators. The relative strength index (RSI)(14) is overbought at the 75 level. This indicator can remain overbought for longer periods. Thus, the RSI (14) at the present level indicates a bullish rally ahead. |

|
| FIGURE 1: $XCI, HOURLY. The breakout here has first resistance of a previous high at the 895 level. This resistance will be the first intraday target on this breakout. |
| Graphic provided by: StockCharts.com. |
| |
| The average directional movement index (ADX)(14) is at 29, indicating a developed uptrend. The uptrend can continue as the indicator is considered overheated only above 40. The moving average convergence/divergence (MACD)(12,26,9) is positive as well. In addition, the 50-day EMA is ready for an upside journey and the 200-day EMA is tipped downward. The moving averages may have a bullish crossover but this crossover is yet to happen. Hence, traders can just watch this crossover and trade according to the confirmed indication. Thus on an intraday basis, traders can go long with a target of 895, which is the first intraday resistance above the 200-day EMA with a stop-loss of a 200-day EMA support. |
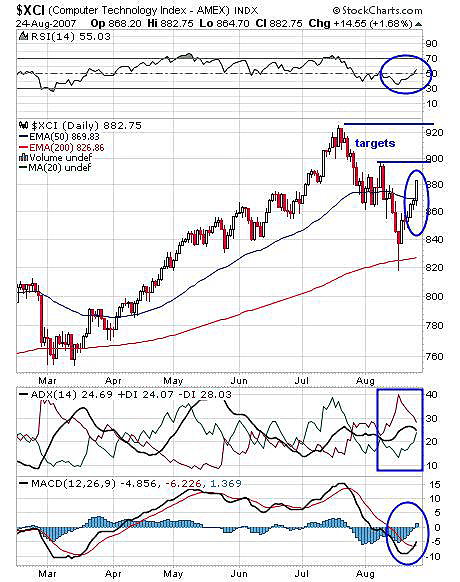
| In Figure 2, the bullish rally began at the 840 level. The candles with long shadows moved below the 200-day EMA support but closed at 840. The upside rally had gained about $42 by closing above the 50-day EMA. Now this moving average will be strong support for this upward move. The rally would have a first target of $900 and then the highest pivot of 925 would be the final target on this level according to Figure 2. |

|
| FIGURE 2: $XCI, DAILY. The 50-day EMA has offered strong support to the breakout on the daily chart. The breakout is on its way to previous high resistances. |
| Graphic provided by: StockCharts.com. |
| |
| The RSI (14) at 55 shows fresh buying opportunity and indicates bullish strength in the rally. The ADX (14) at 24 indicates a developing uptrend with the possibility of an increase in buying pressure in the coming session while sellers' pressure is diminishing. The MACD (12,26,9) is striving for a bullish crossover (with confirmation necessary) in the negative area, but the histogram is giving an advance bullish indication by moving above its zero line. |
| Hence, traders can get a good long trade with a breakout above the 50-day EMA with a target of previous highs. |
Active trader in the Indian stock markets since 2003 and a full-time writer. Trading is largely based upon technical analysis.
| Company: | Independent |
| Address: | C1/3 Parth Indraprasth Towers. Vastrapur |
| Ahmedabad, Guj 380015 | |
| E-mail address: | chaitalimohile@yahoo.co.in |
Traders' Resource Links | |
| Independent has not added any product or service information to TRADERS' RESOURCE. | |
Click here for more information about our publications!
PRINT THIS ARTICLE

Request Information From Our Sponsors
- StockCharts.com, Inc.
- Candle Patterns
- Candlestick Charting Explained
- Intermarket Technical Analysis
- John Murphy on Chart Analysis
- John Murphy's Chart Pattern Recognition
- John Murphy's Market Message
- MurphyExplainsMarketAnalysis-Intermarket Analysis
- MurphyExplainsMarketAnalysis-Visual Analysis
- StockCharts.com
- Technical Analysis of the Financial Markets
- The Visual Investor
- VectorVest, Inc.
- Executive Premier Workshop
- One-Day Options Course
- OptionsPro
- Retirement Income Workshop
- Sure-Fire Trading Systems (VectorVest, Inc.)
- Trading as a Business Workshop
- VectorVest 7 EOD
- VectorVest 7 RealTime/IntraDay
- VectorVest AutoTester
- VectorVest Educational Services
- VectorVest OnLine
- VectorVest Options Analyzer
- VectorVest ProGraphics v6.0
- VectorVest ProTrader 7
- VectorVest RealTime Derby Tool
- VectorVest Simulator
- VectorVest Variator
- VectorVest Watchdog
