HOT TOPICS LIST
- MACD
- Fibonacci
- RSI
- Gann
- ADXR
- Stochastics
- Volume
- Triangles
- Futures
- Cycles
- Volatility
- ZIGZAG
- MESA
- Retracement
- Aroon
INDICATORS LIST
LIST OF TOPICS
PRINT THIS ARTICLE
by Chaitali Mohile
The same pattern has been formed on two charts of different time frames, reinforcing the pattern and the trend.
Position: Buy
Chaitali Mohile
Active trader in the Indian stock markets since 2003 and a full-time writer. Trading is largely based upon technical analysis.
PRINT THIS ARTICLE
ASCENDING TRIANGLES
Kendle Intl. Has Ascending Triangles
08/27/07 11:28:23 AMby Chaitali Mohile
The same pattern has been formed on two charts of different time frames, reinforcing the pattern and the trend.
Position: Buy
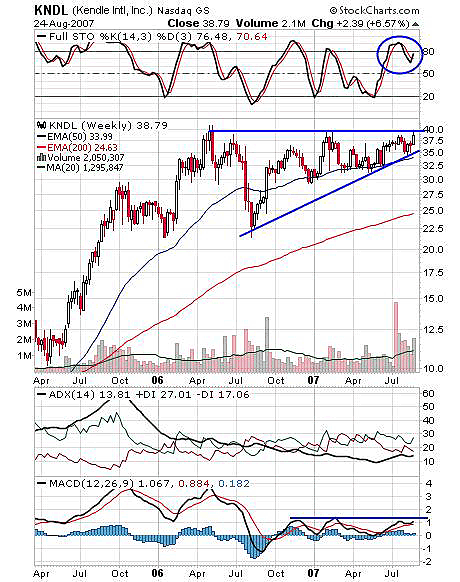
| An ascending triangle has been formed on the weekly chart of Kendle Intl. (KNDL). This triangle appears in an uptrend as a continuation pattern. In Figure 1 the seller's line appears at the $40 level. KNDL has retraced back to 50-day exponential moving average (EMA) from $40. At one point it moved far below the 50-day EMA, thus forming a lower trendline known as a buyer's line. Apart from the buyer's line, the moving average has offered strong support to the security even during smaller range-bound moves. Volume has also exhausted with narrow moves. The ascending triangle is considered to be a bullish indication. An upside breakout would confirm the uptrend to continue and the security to undergo more upside rally. In addition, the triangle has appeared on the weekly chart so the view is medium term with medium-term targets. |

|
| FIGURE 1: KNDL, WEEKLY. The confirmed breakout of the triangle will see the minimum level of $57.50. |
| Graphic provided by: StockCharts.com. |
| |
| The average directional movement index (ADX)(14) suggests that the narrow range-bound move can continue for some more time. The positive direction index (+DI) and negative directional index (-DI) are closer to each other; also, the ADX is below 15, which indicates consolidation till it moves above 20. The stochastic (14,3,3) here is interesting. During the triangle formation, the stochastic turned overbought around the 85 level. As a result, the indicator turned back to create room for an upside rally instead of moving flat in an overbought area. Effectively, the price also moves in the same rhythm, forming the triangle. Finally, the stochastic at 77 indicates a large upside space for a bullish rally. The moving average convergence/divergence (MACD)(12,26,9) is positive given that it is above the zero-line and shows a bullish crossover. The triple-top resistance in the MACD (12,26,9) can get violated on positive indicators and a bullish price force. |
| Under these bullish signals, traders can measure a healthy medium target on an ascending triangle. To calculate the minimum level, the width of triangle is added to the breakout level; $40 - $22.50 = $17.50 + $40 = $57.50 will be the final target on the bullish rally. Traders are thus recommended to go long only on a confirmed breakout above $40. |

|
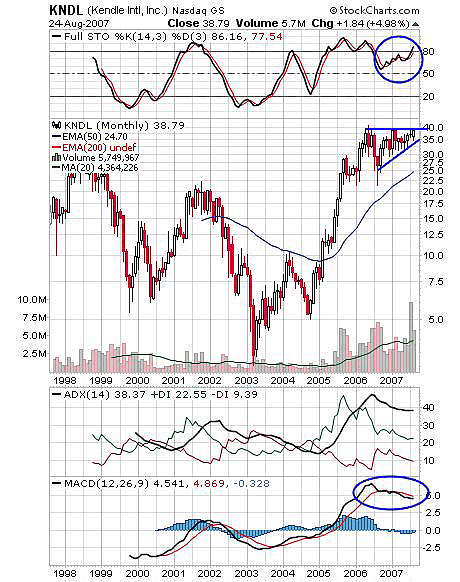
| FIGURE 2: KNDL, MONTHLY. An ascending triangle being formed has reinforced the pattern. The breakout will be stronger and sustainable. |
| Graphic provided by: StockCharts.com. |
| |
| The monthly chart also displays an ascending triangle(Figure 2). This reinforces the formation and reconfirms that the uptrend will last longer. The stochastic (14,3,3) has moved vertically upward and still has room. The ADX (14) has declined from an overheated area above 40 in mid-2006. But the indicator stood firmly above 35 instead of declining further, thus indicating the strength in uptrend. Currently, the ADX (14) is 38, indicating a well-developed uptrend. The MACD (12,26,9) is moderately below its trigger line in the positive area, so the indicator is bullish. |
| Bear in mind that weekly and monthly are both long-term charts. So this stock with the target calculated above should be viewed with an investment perspective and not as a trading opportunity. For short-term traders who wish to grab this buying opportunity, I would suggest they follow strict stop-losses and book profits as the stock consolidates. |
Active trader in the Indian stock markets since 2003 and a full-time writer. Trading is largely based upon technical analysis.
| Company: | Independent |
| Address: | C1/3 Parth Indraprasth Towers. Vastrapur |
| Ahmedabad, Guj 380015 | |
| E-mail address: | chaitalimohile@yahoo.co.in |
Traders' Resource Links | |
| Independent has not added any product or service information to TRADERS' RESOURCE. | |
Click here for more information about our publications!
PRINT THIS ARTICLE

Request Information From Our Sponsors
- StockCharts.com, Inc.
- Candle Patterns
- Candlestick Charting Explained
- Intermarket Technical Analysis
- John Murphy on Chart Analysis
- John Murphy's Chart Pattern Recognition
- John Murphy's Market Message
- MurphyExplainsMarketAnalysis-Intermarket Analysis
- MurphyExplainsMarketAnalysis-Visual Analysis
- StockCharts.com
- Technical Analysis of the Financial Markets
- The Visual Investor
- VectorVest, Inc.
- Executive Premier Workshop
- One-Day Options Course
- OptionsPro
- Retirement Income Workshop
- Sure-Fire Trading Systems (VectorVest, Inc.)
- Trading as a Business Workshop
- VectorVest 7 EOD
- VectorVest 7 RealTime/IntraDay
- VectorVest AutoTester
- VectorVest Educational Services
- VectorVest OnLine
- VectorVest Options Analyzer
- VectorVest ProGraphics v6.0
- VectorVest ProTrader 7
- VectorVest RealTime Derby Tool
- VectorVest Simulator
- VectorVest Variator
- VectorVest Watchdog
