HOT TOPICS LIST
- MACD
- Fibonacci
- RSI
- Gann
- ADXR
- Stochastics
- Volume
- Triangles
- Futures
- Cycles
- Volatility
- ZIGZAG
- MESA
- Retracement
- Aroon
INDICATORS LIST
LIST OF TOPICS
PRINT THIS ARTICLE
by Chaitali Mohile
GE held back the gap up rally with a moving average resistance.
Position: N/A
Chaitali Mohile
Active trader in the Indian stock markets since 2003 and a full-time writer. Trading is largely based upon technical analysis.
PRINT THIS ARTICLE
GAPS
General Electric Caught In Wide Range
08/24/07 02:56:01 PMby Chaitali Mohile
GE held back the gap up rally with a moving average resistance.
Position: N/A
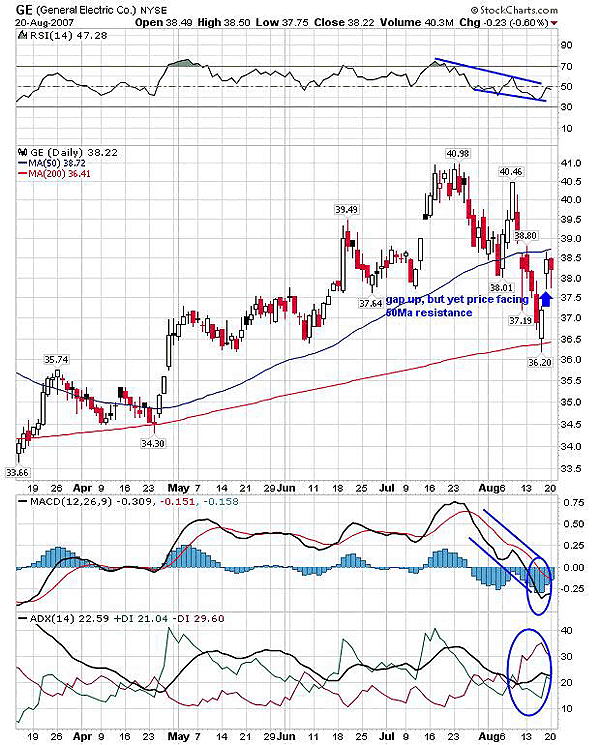
| General Electric (GE) was at its high when the US financial crisis began. The relative strength index (RSI) (14) was overbought at the price of $40. Though this indicator can remain overbought for longer periods, the bearish pressure in the entire market pulled down the indicator along with the price. The correction turned more serious and the stock established support at the 200-day moving average (MA), losing about $4. Here, along with strong support, GE has an immediate resistance at the 50-day MA. A gap up opening indicated by the blue arrow attempted to break above the resistance level. Generally, gaps get filled sooner or later but in the case of GE, it's likely that the wait for the gap to get filled won't last. Resistance at the 50-day MA may have the price retrace back to the 200-day MA. From there the price is likely to move within the support & resistance areas of moving averages. |
| In Figure 1, the RSI (14) shows bearish strength. The lower lows and lower highs with failed recovery add to the bearish view. The moving average convergence/divergence (MACD)(12,26,9) after a bearish crossover gradually moved below the zero-line. The MACD (12,26,9) is ready to move above its trigger line for a bullish crossover, but you should probably wait for confirmation. In addition, the average directional movement index (ADX)(14) at 22 has bullish and bearish pressure hovering above the trend. |

|
| FIGURE 1: GE, DAILY. The 50-day MA obstructs the bullish move after the price gaps up. The resistance may lead to a wide-range price movement. |
| Graphic provided by: StockCharts.com. |
| |
| The overall scenario of the daily chart asks for more confirmed breakouts in price and indicators. All the three indicators are neither bullish nor bearish and the price after gap up is under 50-day MA. I would recommend traders wait till the 50-day MA takes off. |
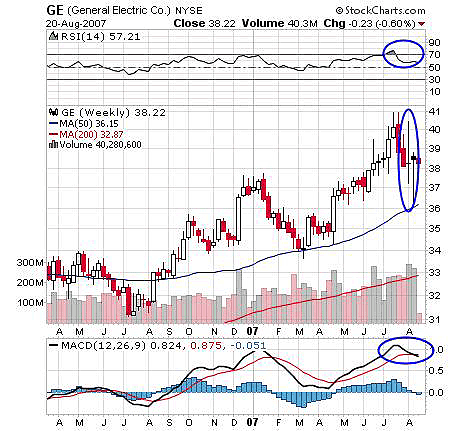
| Figure 2, the weekly chart, has two candles that also leave traders directionless. The long-legged doji has a typical doji indication of indecision and lack of confidence in traders. The second bearish candle with a long lower shadow indicates weakness as well. The 50-day MA offered support to the long lower shadow, and the price rushed to close near the open of the week. The RSI (14) has declined from the overbought area but is still holding some bullish strength. The MACD (12,26,9) is likely to be bearish with a bearish crossover but needs confirmation. |

|
| FIGURE 2: GE, WEEKLY. The doji followed by a long-legged candle indicate weakness in GE, resulting in a range-bound move till the direction of the price movement is known. |
| Graphic provided by: StockCharts.com. |
| |
| There is no perfect direction on either chart. The range-bound move in this scenario is thus very much possible. |
Active trader in the Indian stock markets since 2003 and a full-time writer. Trading is largely based upon technical analysis.
| Company: | Independent |
| Address: | C1/3 Parth Indraprasth Towers. Vastrapur |
| Ahmedabad, Guj 380015 | |
| E-mail address: | chaitalimohile@yahoo.co.in |
Traders' Resource Links | |
| Independent has not added any product or service information to TRADERS' RESOURCE. | |
Click here for more information about our publications!
PRINT THIS ARTICLE

Request Information From Our Sponsors
- StockCharts.com, Inc.
- Candle Patterns
- Candlestick Charting Explained
- Intermarket Technical Analysis
- John Murphy on Chart Analysis
- John Murphy's Chart Pattern Recognition
- John Murphy's Market Message
- MurphyExplainsMarketAnalysis-Intermarket Analysis
- MurphyExplainsMarketAnalysis-Visual Analysis
- StockCharts.com
- Technical Analysis of the Financial Markets
- The Visual Investor
- VectorVest, Inc.
- Executive Premier Workshop
- One-Day Options Course
- OptionsPro
- Retirement Income Workshop
- Sure-Fire Trading Systems (VectorVest, Inc.)
- Trading as a Business Workshop
- VectorVest 7 EOD
- VectorVest 7 RealTime/IntraDay
- VectorVest AutoTester
- VectorVest Educational Services
- VectorVest OnLine
- VectorVest Options Analyzer
- VectorVest ProGraphics v6.0
- VectorVest ProTrader 7
- VectorVest RealTime Derby Tool
- VectorVest Simulator
- VectorVest Variator
- VectorVest Watchdog
