HOT TOPICS LIST
- MACD
- Fibonacci
- RSI
- Gann
- ADXR
- Stochastics
- Volume
- Triangles
- Futures
- Cycles
- Volatility
- ZIGZAG
- MESA
- Retracement
- Aroon
INDICATORS LIST
LIST OF TOPICS
PRINT THIS ARTICLE
by Koos van der Merwe
The XAU i-Share is close to thinking so.
Position: Accumulate
Koos van der Merwe
Has been a technical analyst since 1969, and has worked as a futures and options trader with First Financial Futures in Johannesburg, South Africa.
PRINT THIS ARTICLE
OSCILLATORS
Is It Time To Nibble At Gold?
08/24/07 09:42:50 AMby Koos van der Merwe
The XAU i-Share is close to thinking so.
Position: Accumulate
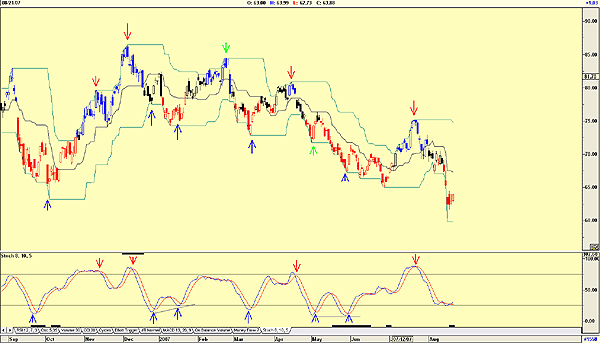
| Figure 1 shows the XAU with Donchian channels. (20,0). The blue and red arrows on the chart are suggested buy and sell positions. In all cases I have suggested a buy when the Donchian lower bar has been reached and the stochastic oscillator (8,10) is below the 20 horizontal line and has given a buy signal. A sell signal is when the upper Donchian channel is reached and the stochastic (8,10) is oversold and given a sell signal. At the moment, the i-Share does appear to be touching the lower Donchian channel, but the stochastic oscillator is not quite oversold although it does appear to be touching the 20 level. We could wait for a lower level before buying. |

|
| FIGURE 1: XAU i-Share WITH DONCHIAN CHANNELS. The blue and red arrows are suggested buy and sell positions. |
| Graphic provided by: AdvancedGET. |
| |
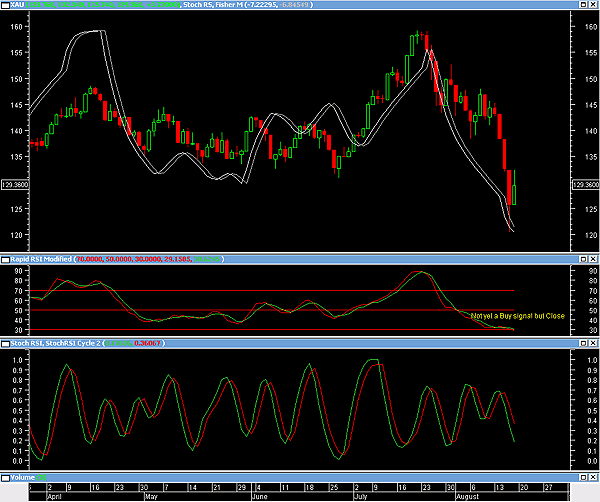
| Figure 2 suggests that although a buy signal is close, it has not been triggered yet. My indicators used are as follows. a. Superimposed on the index is a Fisher transform of the MACD of the highs. This indicator is still suggesting weakness. b. Rapid RSI modified. Although the indicator is playing with the lower level, it has not yet suggested a buy signal. c. The stochastic RSI is still falling. |

|
| FIGURE 2: XAU i-SHARE WITH VARIOUS OSCILLATORS. A buy signal may be close, but not just yet. |
| Graphic provided by: MetaStock. |
| |
| Although the XAU i-Share looks promising, a buy signal has not been given as of yet, but it is worth watching because a signal could be triggered in the near future. Is it time to nibble at gold? Not yet, but you could taste it. |
Has been a technical analyst since 1969, and has worked as a futures and options trader with First Financial Futures in Johannesburg, South Africa.
| Address: | 3256 West 24th Ave |
| Vancouver, BC | |
| Phone # for sales: | 6042634214 |
| E-mail address: | petroosp@gmail.com |
Click here for more information about our publications!
PRINT THIS ARTICLE

Request Information From Our Sponsors
- VectorVest, Inc.
- Executive Premier Workshop
- One-Day Options Course
- OptionsPro
- Retirement Income Workshop
- Sure-Fire Trading Systems (VectorVest, Inc.)
- Trading as a Business Workshop
- VectorVest 7 EOD
- VectorVest 7 RealTime/IntraDay
- VectorVest AutoTester
- VectorVest Educational Services
- VectorVest OnLine
- VectorVest Options Analyzer
- VectorVest ProGraphics v6.0
- VectorVest ProTrader 7
- VectorVest RealTime Derby Tool
- VectorVest Simulator
- VectorVest Variator
- VectorVest Watchdog
- StockCharts.com, Inc.
- Candle Patterns
- Candlestick Charting Explained
- Intermarket Technical Analysis
- John Murphy on Chart Analysis
- John Murphy's Chart Pattern Recognition
- John Murphy's Market Message
- MurphyExplainsMarketAnalysis-Intermarket Analysis
- MurphyExplainsMarketAnalysis-Visual Analysis
- StockCharts.com
- Technical Analysis of the Financial Markets
- The Visual Investor
