HOT TOPICS LIST
- MACD
- Fibonacci
- RSI
- Gann
- ADXR
- Stochastics
- Volume
- Triangles
- Futures
- Cycles
- Volatility
- ZIGZAG
- MESA
- Retracement
- Aroon
INDICATORS LIST
LIST OF TOPICS
PRINT THIS ARTICLE
by Gary Grosschadl
As the markets bounce, many stocks will try to follow, including Best Buy Co.
Position: Hold
Gary Grosschadl
Independent Canadian equities trader and technical analyst based in Peterborough
Ontario, Canada.
PRINT THIS ARTICLE
DOUBLE TOPS
Best Buy Co. Testing A Double Top
08/24/07 09:55:34 AMby Gary Grosschadl
As the markets bounce, many stocks will try to follow, including Best Buy Co.
Position: Hold
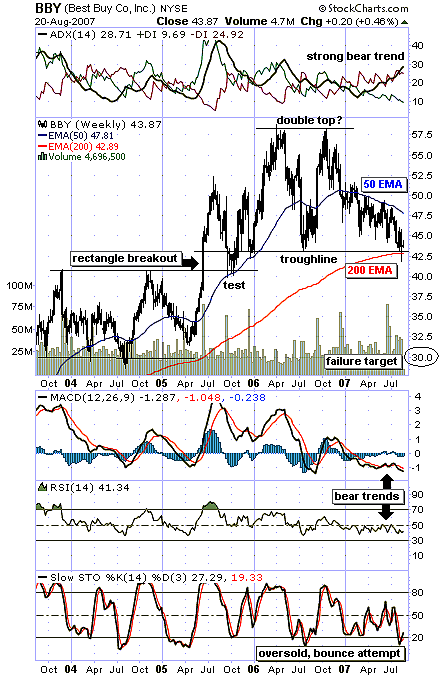
| Figure 1, a multiyear weekly chart, shows two major chart formations. The bottom of the chart shows a large base formation in the form of a rectangle. Note the breakout on excellent volume. As often seen in breakout formations, the move came back to test the breakout point. This was also good support from the 50-period exponential moving average (EMA), which held support until the peak move. |
| The second major formation is the current double top attempt. After the first peak of near $58, a trendline was established near $43. This was then followed by the second peak. Now this trendline is being tested to see whether the double top is valid -- that is, if it falls to the downside below the trendline. Note the strong support here by virtue of the 200-period EMA. This kind of major support often guarantees at least a bounce attempt, if not a major turning point. The test going forward will be the overhead resistance line offered by the 50-day EMA. Failure there may lead to another 200-day EMA support test and another crack at completing the double top. |

|
| FIGURE 1: BEST BUY, WEEKLY. BBY shows two large technical formations. |
| Graphic provided by: StockCharts.com. |
| |
| Should the double top come to fruition down the road, the downside completion target equals the distance from the peak to the trendline as applied below the trendline. This equates roughly: 43 - 15 = 28. Let's say the bottom of the rectangle is at $30. This would be a large downside move should the bears prevail. |
| Several indicators are examined. At the top of the chart, the directional movement indicator (DMI) shows a strong bearish trend with a rising ADX (average directional movement index) amid bearishly poised DIs (directional indicators). Below the chart, we see the moving average convergence/divergence (MACD) and the relative strength index (RSI) both showing bearishness below their respective zero-line and 50 level. The stochastic oscillator with its greater sensitivity shows a bounce attempt from oversold levels. |
| In summary, watch for a move either below the 200-day EMA or a move above the 50-day EMA to show either bearish or bullish follow-through. That should be the telling sign of the next big move to possibly test the top or bottom of this chart. |
Independent Canadian equities trader and technical analyst based in Peterborough
Ontario, Canada.
| Website: | www.whatsonsale.ca/financial.html |
| E-mail address: | gwg7@sympatico.ca |
Click here for more information about our publications!
PRINT THIS ARTICLE

Request Information From Our Sponsors
- StockCharts.com, Inc.
- Candle Patterns
- Candlestick Charting Explained
- Intermarket Technical Analysis
- John Murphy on Chart Analysis
- John Murphy's Chart Pattern Recognition
- John Murphy's Market Message
- MurphyExplainsMarketAnalysis-Intermarket Analysis
- MurphyExplainsMarketAnalysis-Visual Analysis
- StockCharts.com
- Technical Analysis of the Financial Markets
- The Visual Investor
- VectorVest, Inc.
- Executive Premier Workshop
- One-Day Options Course
- OptionsPro
- Retirement Income Workshop
- Sure-Fire Trading Systems (VectorVest, Inc.)
- Trading as a Business Workshop
- VectorVest 7 EOD
- VectorVest 7 RealTime/IntraDay
- VectorVest AutoTester
- VectorVest Educational Services
- VectorVest OnLine
- VectorVest Options Analyzer
- VectorVest ProGraphics v6.0
- VectorVest ProTrader 7
- VectorVest RealTime Derby Tool
- VectorVest Simulator
- VectorVest Variator
- VectorVest Watchdog
