

HOT TOPICS LIST
- MACD
- Fibonacci
- RSI
- Gann
- ADXR
- Stochastics
- Volume
- Triangles
- Futures
- Cycles
- Volatility
- ZIGZAG
- MESA
- Retracement
- Aroon
INDICATORS LIST
LIST OF TOPICS
PRINT THIS ARTICLE
by Chaitali Mohile
The bullish rally after a bullish reversal pattern is under strong resistance. Along with the price, one of the indicators retraces back from its previous high.
Position: N/A
Chaitali Mohile
Active trader in the Indian stock markets since 2003 and a full-time writer. Trading is largely based upon technical analysis.
PRINT THIS ARTICLE
CORRELATION ANALYSIS
Bank Index Pullback In Danger
08/24/07 08:38:29 AMby Chaitali Mohile
The bullish rally after a bullish reversal pattern is under strong resistance. Along with the price, one of the indicators retraces back from its previous high.
Position: N/A
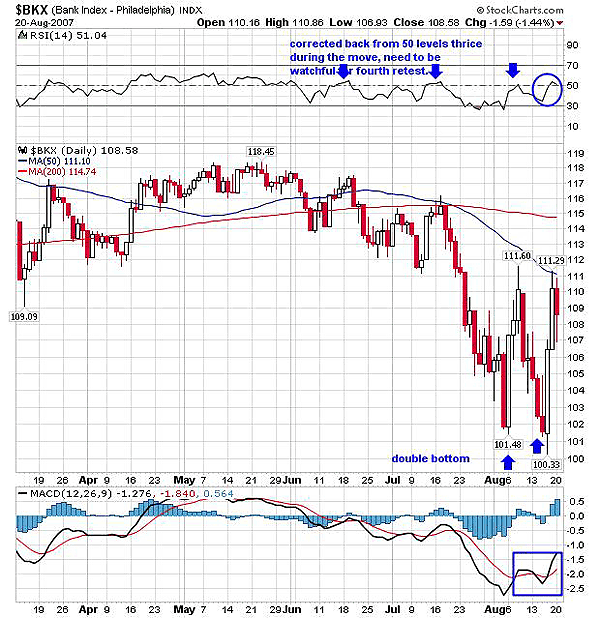
| The Bank Index ($BKX) plunged harder after a bearish moving average (MA) crossover, making a low of 101. The first pullback failed under the resistance of 50-day MA and rallied back to a low pivot at 101, forming a double bottom. A double bottom is a bullish reversal pattern, indicating a bullish rally to begin soon. With this reversal pattern, the index was able to rally back to a 50-day MA resistance, but the $BKX had dual hurdles at almost the same level. First was the 50-day MA resistance, and the other was the previous high. Though the index had a bullish reversal pattern on Figure 1, it lacked positive strength to carry forward the upside rally. Above the 50-day MA, the 200-day MA is the next resistance, but the gap between them is $5, and that can be achieved if the index gets positive support. |
|
| FIGURE 1: $BKX, DAILY. The bullish rally after the double bottom faced the 50-day MA and previous high resistance. The positive market participants and bullish technical indicators helped a price breakout. |
| Graphic provided by: StockCharts.com. |
| |
| The relative strength index (RSI)(14) corrected three times from the 50 level. It failed to get the golden support required for the bullish rally. The bearish crossover of MAs only pulled the RSI (14) marginally in the oversold zone, but recovered quickly. However, it could not break through the 50 level and retraced back. With the double bottom, the RSI (14) surged, moving above the 50 level. The indicator's fourth attempt really needed a close watch as the RSI again tipped down; in addition, the price is under strong resistance. Second, the moving average convergence/divergence (MACD) (12,26,9) has a bullish crossover but is in the negative area. So it has to come back fast to add the technical strength to the pullback rally |
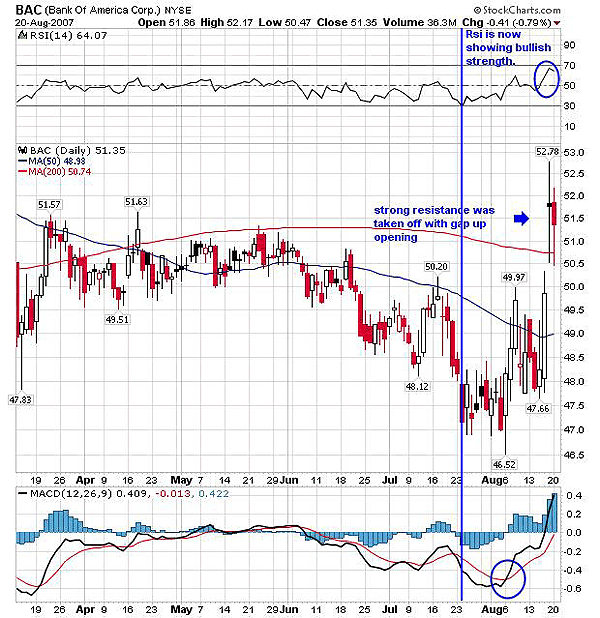
| Bank of America (BAC) had to bear the burns of strong resistance in this index. The BAC had a good gap up, breaking above the 200-day MA resistance. The doji candle that formed indicated indecision, but the stock held at the 200-day MA, which turned into strong support. With $BKX under strong resistance, Bank of America also failed to continue the bullish breakout of resistance. The bearish candle in Figure 2 indicates weakness and lack of confidence among traders. |
|
| FIGURE 2: BAC, DAILY. The bullish RSI (14) and positive MACD (12,26,9) helped price move above the 200-day MA. To sustain above this support, a Bank Index contribution is required. |
| Graphic provided by: StockCharts.com. |
| |
| Both indicators on the daily chart of Bank of America show bullish indication. The strong move in $BKX may pull BAC higher as well. Traders need to be patient till the Banking Index picks up speed. |
Active trader in the Indian stock markets since 2003 and a full-time writer. Trading is largely based upon technical analysis.
| Company: | Independent |
| Address: | C1/3 Parth Indraprasth Towers. Vastrapur |
| Ahmedabad, Guj 380015 | |
| E-mail address: | chaitalimohile@yahoo.co.in |
Traders' Resource Links | |
| Independent has not added any product or service information to TRADERS' RESOURCE. | |
Click here for more information about our publications!
PRINT THIS ARTICLE

Request Information From Our Sponsors
- StockCharts.com, Inc.
- Candle Patterns
- Candlestick Charting Explained
- Intermarket Technical Analysis
- John Murphy on Chart Analysis
- John Murphy's Chart Pattern Recognition
- John Murphy's Market Message
- MurphyExplainsMarketAnalysis-Intermarket Analysis
- MurphyExplainsMarketAnalysis-Visual Analysis
- StockCharts.com
- Technical Analysis of the Financial Markets
- The Visual Investor
- VectorVest, Inc.
- Executive Premier Workshop
- One-Day Options Course
- OptionsPro
- Retirement Income Workshop
- Sure-Fire Trading Systems (VectorVest, Inc.)
- Trading as a Business Workshop
- VectorVest 7 EOD
- VectorVest 7 RealTime/IntraDay
- VectorVest AutoTester
- VectorVest Educational Services
- VectorVest OnLine
- VectorVest Options Analyzer
- VectorVest ProGraphics v6.0
- VectorVest ProTrader 7
- VectorVest RealTime Derby Tool
- VectorVest Simulator
- VectorVest Variator
- VectorVest Watchdog