HOT TOPICS LIST
- MACD
- Fibonacci
- RSI
- Gann
- ADXR
- Stochastics
- Volume
- Triangles
- Futures
- Cycles
- Volatility
- ZIGZAG
- MESA
- Retracement
- Aroon
INDICATORS LIST
LIST OF TOPICS
PRINT THIS ARTICLE
by David Penn
The MACD histogram peak in the second half of August suggests that the US dollar's advance has more room to run.
Position: N/A
David Penn
Technical Writer for Technical Analysis of STOCKS & COMMODITIES magazine, Working-Money.com, and Traders.com Advantage.
PRINT THIS ARTICLE
REVERSAL
September Greenback: Histogram Hints Higher
08/23/07 10:05:19 AMby David Penn
The MACD histogram peak in the second half of August suggests that the US dollar's advance has more room to run.
Position: N/A
| Earlier in August, I noted a pair of bullish candlestick patterns that formed as the greenback futures, basis September, made their lows in late July ("Belt Holds Bolster The Dollar," Traders.com Advantage, August 2, 2007). |

|
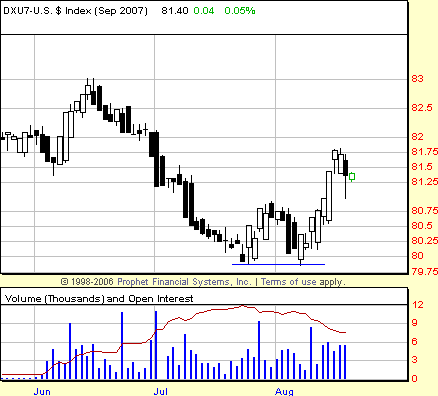
| FIGURE 1: US DOLLAR INDEX, SEPTEMBER FUTURES, DAILY. The retest of the July lows in early August also formed a 2B bottom, a major reversal pattern traders often use to catch the very low point of a falling market. Nearby resistance is just north of 82. Support is at the level of the breakout just north of 80.75. |
| Graphic provided by: Prophet Financial, Inc. |
| |
| As markets often do, the lows of July were to be tested in early August as the bounce toward the end of the earlier month led to a decline at the beginning of the latter (Figure 1). This decline, notably, did not set a new closing low when the lows were tested on August 6. This, combined with the positive divergence in the moving average convergence/divergence (MACD) histogram that had been developing since July, gave the bulls the confidence they needed to bid the market for September dollars higher. |

|
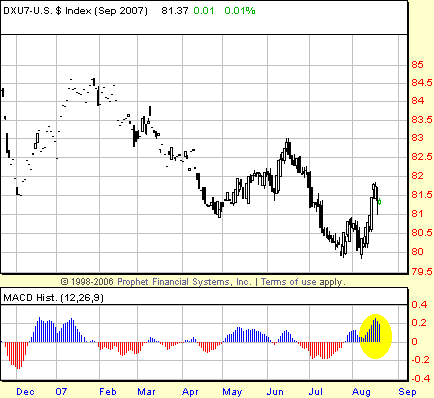
| FIGURE 2: US DOLLAR INDEX, SEPTEMBER FUTURES, DAILY. The size of the MACD histogram in August is larger than that any any histogram peak since the September dollar topped in January. This is often a sign that the bounce off the lows is for real — albeit often after a significant pullback or retest of the lows. Note how a sizable histogram peak in May appeared after a series of much lower peaks, heralding an advance that extended into June. |
| Graphic provided by: Prophet Financial, Inc. |
| |
| Bulls may find additional confidence in the behavior of the MACD histogram. As I have written in Traders.com Advantage and Working-Money.com, when sizable peaks in the MACD histogram accompany bounces after significant declines, they often confirm that a change in trend — or at least a significant countertrend movement — is in the making. These extreme peaks in the MACD histogram are especially good confirmation patterns when they occur after positive divergences in the MACD histogram or other momentum indicators. |
| In Figure 2 we have a MACD histogram peak in August that is larger than any such peak since January. In the context of a declining market, this is a hint that the September greenback is able to move higher — specifically, able to move higher than the high accompanying the MACD histogram extreme, which in this case means a move above, roughly, the 82 level. |

|
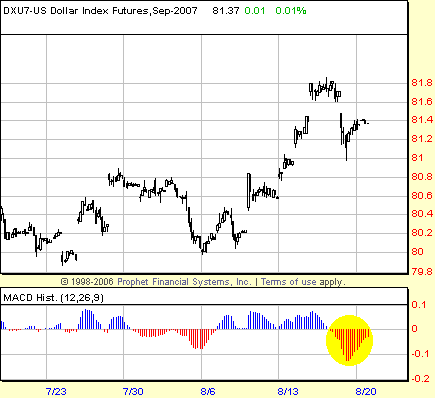
| FIGURE 3: US DOLLAR INDEX, SEPTEMBER FUTURES, HOURLY. The same analysis of MACD histogram extremes also applies with extremes to the downside. The highlighted MACD histogram trough is deeper than any in several days and suggests that the current correction in the September greenback (seen here in the hourly chart) is not yet complete. |
| Graphic provided by: Prophet Financial, Inc. |
| |
| Figure 3 gives a close-up look at what the rally in the US dollar is up against. This hourly chart shows how the market peaked near midmonth, forming an island top in the typically discontinuous US dollar index futures. On the correction lower, the September greenback formed a particularly deep MACD histogram trough. In the same way that an especially large MACD histogram peak in the daily chart signaled higher prices, this deep MACD histogram trough suggests that the price that was reached when the trough was created (namely the 81 level) is likely to be exceeded to before the correction is complete. |
Technical Writer for Technical Analysis of STOCKS & COMMODITIES magazine, Working-Money.com, and Traders.com Advantage.
| Title: | Technical Writer |
| Company: | Technical Analysis, Inc. |
| Address: | 4757 California Avenue SW |
| Seattle, WA 98116 | |
| Phone # for sales: | 206 938 0570 |
| Fax: | 206 938 1307 |
| Website: | www.Traders.com |
| E-mail address: | DPenn@traders.com |
Traders' Resource Links | |
| Charting the Stock Market: The Wyckoff Method -- Books | |
| Working-Money.com -- Online Trading Services | |
| Traders.com Advantage -- Online Trading Services | |
| Technical Analysis of Stocks & Commodities -- Publications and Newsletters | |
| Working Money, at Working-Money.com -- Publications and Newsletters | |
| Traders.com Advantage -- Publications and Newsletters | |
| Professional Traders Starter Kit -- Software | |
Click here for more information about our publications!
Comments

Request Information From Our Sponsors
- StockCharts.com, Inc.
- Candle Patterns
- Candlestick Charting Explained
- Intermarket Technical Analysis
- John Murphy on Chart Analysis
- John Murphy's Chart Pattern Recognition
- John Murphy's Market Message
- MurphyExplainsMarketAnalysis-Intermarket Analysis
- MurphyExplainsMarketAnalysis-Visual Analysis
- StockCharts.com
- Technical Analysis of the Financial Markets
- The Visual Investor
- VectorVest, Inc.
- Executive Premier Workshop
- One-Day Options Course
- OptionsPro
- Retirement Income Workshop
- Sure-Fire Trading Systems (VectorVest, Inc.)
- Trading as a Business Workshop
- VectorVest 7 EOD
- VectorVest 7 RealTime/IntraDay
- VectorVest AutoTester
- VectorVest Educational Services
- VectorVest OnLine
- VectorVest Options Analyzer
- VectorVest ProGraphics v6.0
- VectorVest ProTrader 7
- VectorVest RealTime Derby Tool
- VectorVest Simulator
- VectorVest Variator
- VectorVest Watchdog
