HOT TOPICS LIST
- MACD
- Fibonacci
- RSI
- Gann
- ADXR
- Stochastics
- Volume
- Triangles
- Futures
- Cycles
- Volatility
- ZIGZAG
- MESA
- Retracement
- Aroon
INDICATORS LIST
LIST OF TOPICS
PRINT THIS ARTICLE
by Chaitali Mohile
$OEX has turned positive, leaving behind some of its resistance.
Position: Buy
Chaitali Mohile
Active trader in the Indian stock markets since 2003 and a full-time writer. Trading is largely based upon technical analysis.
PRINT THIS ARTICLE
FLAGS AND PENNANTS
The S&P 100 Index Bounces Back
08/24/07 08:33:20 AMby Chaitali Mohile
$OEX has turned positive, leaving behind some of its resistance.
Position: Buy
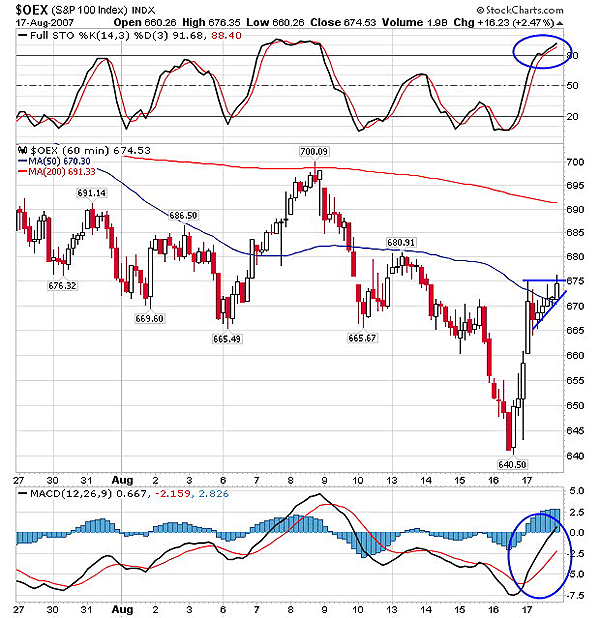
| The bullish rally on the Standard & Poor's 100 index began at closing on August 16, followed by a strong opening on August 17 as the Federal Reserve came in with discount cut news. The rally strengthened as the entire market surged with the news. The entire advance rally gave almost $35 to traders. Thereafter, throughout the intraday session, the index turned sideways in a 10-point range. This day-and-a-half move formed a flag & pennant pattern on the intraday chart (Figure 1). According to the chart, the index closed at the support of the 50-day moving average (MA). The first and closest intraday hurdle of the 50-day MA was taken off with the upward swing of the US financial markets |

|
| FIGURE 1: $OEX, HOURLY. The flag & pennant breakout will see the minimum level of $710. In between, the resistance — likely at 200-day moving average and the previous intraday high at $700 — may get violated. |
| Graphic provided by: StockCharts.com. |
| |
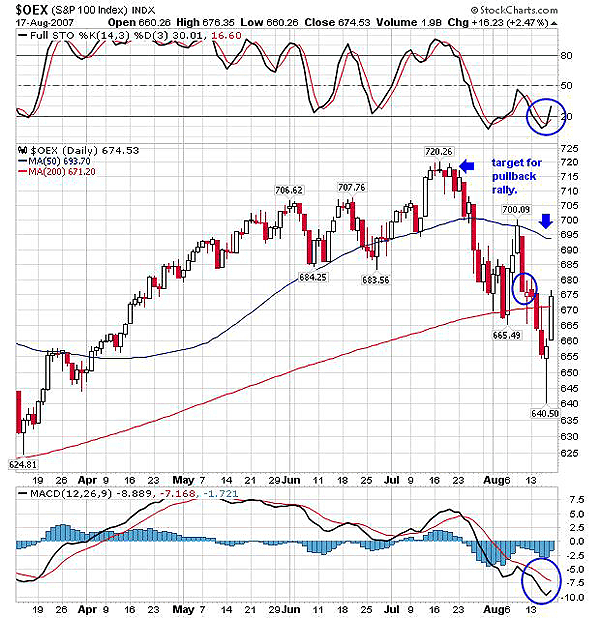
| In Figure 2, the 200-day MA resistance turned into support by the bullish weekend closing. The long bullish candle closed above the 200-day MA, with the high made at the $676 level. The smallest note I would like to highlight here is that during the downfall, the $OEX had a moderate halt in the range of $675-$680 (the marked circle). And the previous trading session closed under the same resistance levels, so there arises a possibility of a minor sideways move on positive ground. With all the mishaps in past weeks, the smallest possibility cannot be ignored. |
| The stochastic (14, 3, 3) is likely to open new trading opportunities by moving above the 20 level. The journey from oversold levels (20) can definitely be bought. The MACD (12, 26, 9) is still not in favor of bulls. The MACD (12, 26, 9) needs to confirm a bullish crossover to strengthen the rally. This opposite sign again diverts the mind from the minor sideways move at the $676 level. This minor consolidation may also help the MACD (12,26,9) turn fully positive, but the entire picture shows that bulls are back in form and ready to jump over the hurdles on their way. The 50-day MA is the next resistance of the pullback rally. The previous high of $720 would act as the final target for this move. Above this level, a rally may begin. |

|
| FIGURE 2: $OEX, DAILY. The resistance of the 50-day moving average is crucial for the bullish rally. Above this hurdle, $720 remains the final target in this upside move. |
| Graphic provided by: StockCharts.com. |
| |
| Thus, the flag & pennant breakout can be bought with the target of $710 first as per our calculation and then look toward $720 as the highest level to achieve on the rally. |
Active trader in the Indian stock markets since 2003 and a full-time writer. Trading is largely based upon technical analysis.
| Company: | Independent |
| Address: | C1/3 Parth Indraprasth Towers. Vastrapur |
| Ahmedabad, Guj 380015 | |
| E-mail address: | chaitalimohile@yahoo.co.in |
Traders' Resource Links | |
| Independent has not added any product or service information to TRADERS' RESOURCE. | |
Click here for more information about our publications!
PRINT THIS ARTICLE

|

Request Information From Our Sponsors
- StockCharts.com, Inc.
- Candle Patterns
- Candlestick Charting Explained
- Intermarket Technical Analysis
- John Murphy on Chart Analysis
- John Murphy's Chart Pattern Recognition
- John Murphy's Market Message
- MurphyExplainsMarketAnalysis-Intermarket Analysis
- MurphyExplainsMarketAnalysis-Visual Analysis
- StockCharts.com
- Technical Analysis of the Financial Markets
- The Visual Investor
- VectorVest, Inc.
- Executive Premier Workshop
- One-Day Options Course
- OptionsPro
- Retirement Income Workshop
- Sure-Fire Trading Systems (VectorVest, Inc.)
- Trading as a Business Workshop
- VectorVest 7 EOD
- VectorVest 7 RealTime/IntraDay
- VectorVest AutoTester
- VectorVest Educational Services
- VectorVest OnLine
- VectorVest Options Analyzer
- VectorVest ProGraphics v6.0
- VectorVest ProTrader 7
- VectorVest RealTime Derby Tool
- VectorVest Simulator
- VectorVest Variator
- VectorVest Watchdog
