

HOT TOPICS LIST
- MACD
- Fibonacci
- RSI
- Gann
- ADXR
- Stochastics
- Volume
- Triangles
- Futures
- Cycles
- Volatility
- ZIGZAG
- MESA
- Retracement
- Aroon
INDICATORS LIST
LIST OF TOPICS
PRINT THIS ARTICLE
by David Penn
April heating oil has formed a characteristic pattern as it beats a hasty retreat from its October 2000 peak.
Position: N/A
David Penn
Technical Writer for Technical Analysis of STOCKS & COMMODITIES magazine, Working-Money.com, and Traders.com Advantage.
PRINT THIS ARTICLE
HEAD & SHOULDERS
April Heating Oil's Head and Shoulders Top
01/11/01 12:16:36 PMby David Penn
April heating oil has formed a characteristic pattern as it beats a hasty retreat from its October 2000 peak.
Position: N/A
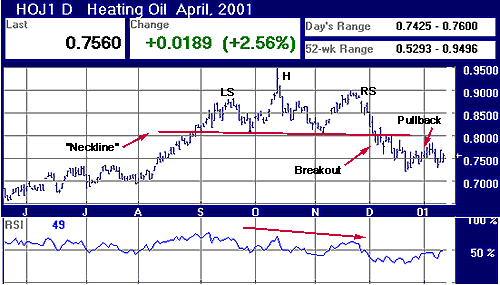
| One of the things traders can do is scan commodities, futures and stocks for tops and bottoms. Whether a trader uses New Highs/New Lows data, or simply e-mail alerts from trading software, half the battle of ferreting out top and bottom chart formations can be eliminated by screening out all those tradables that are not in, or near, new high or new low territory. Having lost track of heating oil near the end of the 2000, I was surprised to open up a chart of the April contract to find out that heating oil prices were not only falling from their late 2000 highs, but also they were moving in a very familiar fashion--a head and shoulders top. |
| The head and shoulders top is one of the most noticeable chart patterns in technical analysis. One of the reasons is because it is among the most easy chart patterns to recognize. Another reason is that the breakout from head and shoulders patterns is often very clear--even though head and shoulders tops often feature pullbacks that can shake out weak traders. In any event, head and shoulders tops are, as their name implies, top formations that anticipate short-term (as in up to three months) bearish reversals. They consist of three clearly defined peaks, with a center peak that is taller than the other two. Volume tends to be heaviest on the early, or left, shoulder, and lightest on the late, or right, shoulder. |
|
| The January pullback in April heating oil may be another opportunity for traders to take advantage of the short side of a head and shoulders top. |
| Graphic provided by: FutureSource.com. |
| |
| April heating oil ramped up into the first shoulder of a head and shoulders top formation as the summer of 2000 came to a close, peaking at 8,820 on September 20th, and then correcting down to around 8,100 before the end of the month. Prices rebounded quickly in a series of gap-up moves that brought the April contract to its 2000 high of 9,496 in early October. The correction from this peak is what formed the "head" of the head and shoulders pattern. The right shoulder developed during the November rally, when April heating oil moved from above 8,000 to an intermediate peak of about 9,000. The correction from this peak took April heating oil form 9,000 to 7,328 by December 20th. |
| Currently, April heating oil is returning to the downtrend established by the November-December correction mentioned above. April heating oil experienced a brief pullback during the second half of December. Yet because this pullback did not rise back to the level of the breakout--which occurred at the beginning of December at 8,114--the short-term downtrend established in mid-November remains intact. For those who were not in a position to take advantage of the breakout, the pullback often affords a second opportunity to exploit the downside breakout of a head and shoulders top. Given the measure rule for head and shoulders tops--a rule that calls for the distance from the highest peak in the formation to the base of the formation (called the "neckline") to be subtracted from the base--the downside price objective for April heating oil is 6,732.28. |
| While the chart pattern alone is enough to put April heating oil in the bearish column over the short-term, I have also included a chart of the contract's relative strength index. This chart reveals signficant weakness in April heating oil, most obviously in the divergence between the September and October peaks (price action is rising while relative strength is declining). Additionally, the fact that April heating oil has not fallen into the oversold position (below 30 on the RSI) suggests that there might not be much interference in April heating oil's descent to our price objective south of 7,000. |
Technical Writer for Technical Analysis of STOCKS & COMMODITIES magazine, Working-Money.com, and Traders.com Advantage.
| Title: | Technical Writer |
| Company: | Technical Analysis, Inc. |
| Address: | 4757 California Avenue SW |
| Seattle, WA 98116 | |
| Phone # for sales: | 206 938 0570 |
| Fax: | 206 938 1307 |
| Website: | www.Traders.com |
| E-mail address: | DPenn@traders.com |
Traders' Resource Links | |
| Charting the Stock Market: The Wyckoff Method -- Books | |
| Working-Money.com -- Online Trading Services | |
| Traders.com Advantage -- Online Trading Services | |
| Technical Analysis of Stocks & Commodities -- Publications and Newsletters | |
| Working Money, at Working-Money.com -- Publications and Newsletters | |
| Traders.com Advantage -- Publications and Newsletters | |
| Professional Traders Starter Kit -- Software | |
Click here for more information about our publications!
Comments
Date:�/ /Rank:�4Comment:�
Date:�/ /Rank:�5Comment:�

Request Information From Our Sponsors
- StockCharts.com, Inc.
- Candle Patterns
- Candlestick Charting Explained
- Intermarket Technical Analysis
- John Murphy on Chart Analysis
- John Murphy's Chart Pattern Recognition
- John Murphy's Market Message
- MurphyExplainsMarketAnalysis-Intermarket Analysis
- MurphyExplainsMarketAnalysis-Visual Analysis
- StockCharts.com
- Technical Analysis of the Financial Markets
- The Visual Investor
- VectorVest, Inc.
- Executive Premier Workshop
- One-Day Options Course
- OptionsPro
- Retirement Income Workshop
- Sure-Fire Trading Systems (VectorVest, Inc.)
- Trading as a Business Workshop
- VectorVest 7 EOD
- VectorVest 7 RealTime/IntraDay
- VectorVest AutoTester
- VectorVest Educational Services
- VectorVest OnLine
- VectorVest Options Analyzer
- VectorVest ProGraphics v6.0
- VectorVest ProTrader 7
- VectorVest RealTime Derby Tool
- VectorVest Simulator
- VectorVest Variator
- VectorVest Watchdog