HOT TOPICS LIST
- MACD
- Fibonacci
- RSI
- Gann
- ADXR
- Stochastics
- Volume
- Triangles
- Futures
- Cycles
- Volatility
- ZIGZAG
- MESA
- Retracement
- Aroon
INDICATORS LIST
LIST OF TOPICS
PRINT THIS ARTICLE
by Chaitali Mohile
Motorola Inc. faces many hurdles before a pullback, keeping the stock underperforming.
Position: N/A
Chaitali Mohile
Active trader in the Indian stock markets since 2003 and a full-time writer. Trading is largely based upon technical analysis.
PRINT THIS ARTICLE
DESCENDING TRIANGLES
Motorola Shows Negative Bias
08/23/07 12:28:44 PMby Chaitali Mohile
Motorola Inc. faces many hurdles before a pullback, keeping the stock underperforming.
Position: N/A
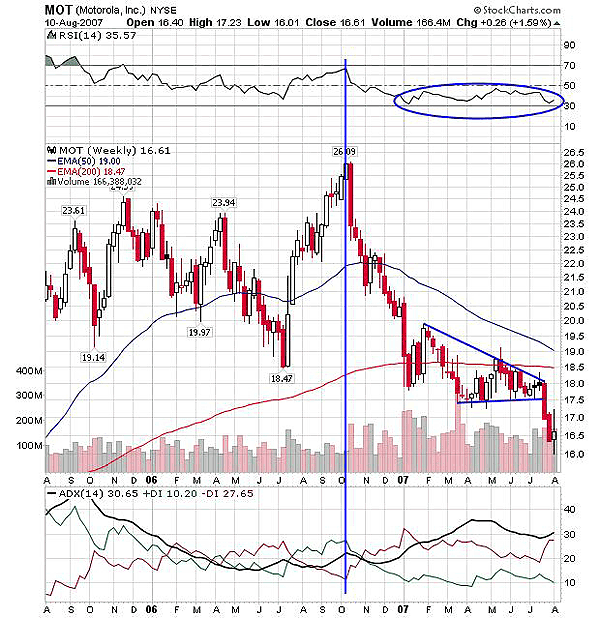
| Motorola (MOT) has been underperforming since late 2006. In its weekly chart (Figure 1), the stock met resistance at around $23 and went above it. It failed to move above $26, however, and tumbled below the 50-day exponential moving average (EMA), losing approximately $8. The 200-day EMA was the ultimate support for this bearish move. The stock consolidated, forming a lower high and further moving in a narrow range. This downside consolidation formed a descending triangle. The descending triangle is a continuation pattern that appears in a downtrend. In addition, the 200-day EMA now becomes a strong resistance level if a pullback begins. The breakout has pulled down to $16.50, losing $2.50. |

|
| FIGURE 1: MOTOROLA, WEEKLY. The descending triangle breakout may see the target of $15. The convergence of the 50-day EMA and the 200-day EMA also points out more downside. |
| Graphic provided by: StockCharts.com. |
| |
| The vertical line on Figure 1, reflects where price hit a high and crashed. The relative strength index (RSI) (14) had a weak bullish rally throughout the period. So as the $26 level was reached, the bulls gave up and bears came back in full strength. The average directional movement index (ADX) (14) also shows the increased pressure of the bears at the same point. |
| The RSI (14) has moved in a narrow range between 50 and 30 since the declining rally in October 2006. At current levels, the indicator is still very bearish. The ADX (14) is indicating a well-developed downtrend. The minimum downside on a breakout can be measured with the height of a triangle. In this case the length of the triangle is 2.50 or $20 minus $17.50. If you subtract $2.50 from $17.50, you get a target of $15. The stock has already reached $16, which means the target is close. If the bulls regain before hitting this target, the 200-day EMA would be the first resistance level. |

|
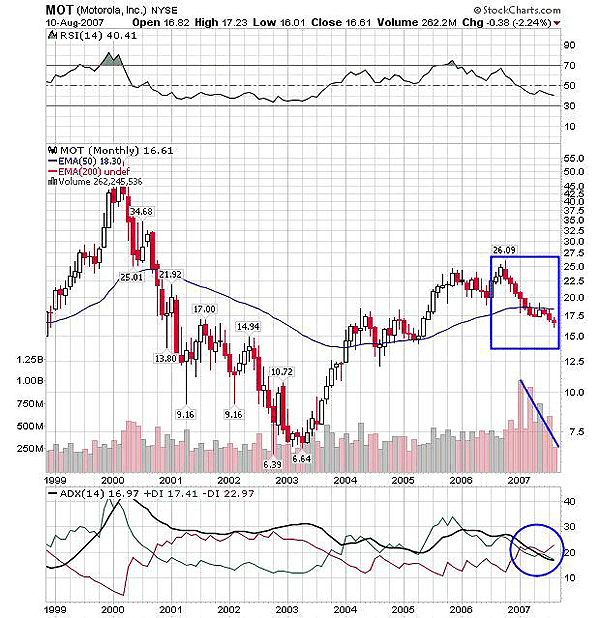
| FIGURE 2: MOTOROLA, MONTHLY. The $15 level seems to be strong support, even in this declining rally. |
| Graphic provided by: StockCharts.com. |
| |
| From figure 2, you can see that the stock went through a huge bear wave moving from $50 to single digits in 2000. MOT is now undergoing a reaction move for its prior three-year correction. During this upside move, prices hit $26 and then moved down drastically. The price has violated the 50-day EMA, and the next support looks to be $15. In 2004-05, the stock consolidated at the same level as the 50-day EMA support. This level is likely to offer strong support again for this decline. The target calculated and the monthly support level goes hand in hand. Traders should be wary hereabouts. The RSI (14) is still tipped down, indicating further bearish moves. Here, the 30 level supports should be observed. The ADX (14) currently is indicating weakness in both trends, but if it moves above 20 with -DI above +DI, the downtrend would become powerful. It appears that Motorola still has further downside ahead. |
Active trader in the Indian stock markets since 2003 and a full-time writer. Trading is largely based upon technical analysis.
| Company: | Independent |
| Address: | C1/3 Parth Indraprasth Towers. Vastrapur |
| Ahmedabad, Guj 380015 | |
| E-mail address: | chaitalimohile@yahoo.co.in |
Traders' Resource Links | |
| Independent has not added any product or service information to TRADERS' RESOURCE. | |
Click here for more information about our publications!
PRINT THIS ARTICLE

Request Information From Our Sponsors
- StockCharts.com, Inc.
- Candle Patterns
- Candlestick Charting Explained
- Intermarket Technical Analysis
- John Murphy on Chart Analysis
- John Murphy's Chart Pattern Recognition
- John Murphy's Market Message
- MurphyExplainsMarketAnalysis-Intermarket Analysis
- MurphyExplainsMarketAnalysis-Visual Analysis
- StockCharts.com
- Technical Analysis of the Financial Markets
- The Visual Investor
- VectorVest, Inc.
- Executive Premier Workshop
- One-Day Options Course
- OptionsPro
- Retirement Income Workshop
- Sure-Fire Trading Systems (VectorVest, Inc.)
- Trading as a Business Workshop
- VectorVest 7 EOD
- VectorVest 7 RealTime/IntraDay
- VectorVest AutoTester
- VectorVest Educational Services
- VectorVest OnLine
- VectorVest Options Analyzer
- VectorVest ProGraphics v6.0
- VectorVest ProTrader 7
- VectorVest RealTime Derby Tool
- VectorVest Simulator
- VectorVest Variator
- VectorVest Watchdog
