HOT TOPICS LIST
- MACD
- Fibonacci
- RSI
- Gann
- ADXR
- Stochastics
- Volume
- Triangles
- Futures
- Cycles
- Volatility
- ZIGZAG
- MESA
- Retracement
- Aroon
INDICATORS LIST
LIST OF TOPICS
PRINT THIS ARTICLE
by Koos van der Merwe
"Buy when you see the blood running in the streets" -- or so goes the quote. Do we see any now?
Position: Hold
Koos van der Merwe
Has been a technical analyst since 1969, and has worked as a futures and options trader with First Financial Futures in Johannesburg, South Africa.
PRINT THIS ARTICLE
ELLIOTT WAVE
The First Drops Of Blood?
08/23/07 09:07:26 AMby Koos van der Merwe
"Buy when you see the blood running in the streets" -- or so goes the quote. Do we see any now?
Position: Hold
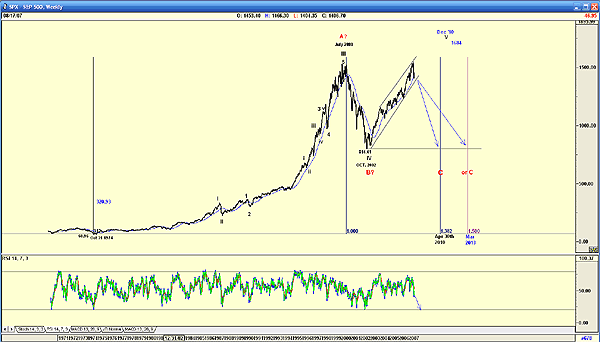
| We all know that the quote came from that dark time when brokers jumped from tall buildings at the time of the Great Crash. Fortunately for today's brokers, the windows of tall buildings cannot be opened. So when do you buy? Do you try to catch a falling knife — that is, buy as the market falls, or do you buy after the market has bottomed, and starts to recover? Obviously the latter. You identify stocks that you would like to own, and buy them after the market has bottomed and starts to recover. Identifying those stocks is not that difficult. CNBC's Jim Kramer uses the formula "PEG" to identify stocks, where the price/earnings ratio is less than twice the growth rate of the company. In today's world, there are many websites that offer this information. On the other hand, identifying the market bottom is more difficult. Is this the bottom? Everybody's been wondering that during the past few days, and as if to answer them, the indexes fall lower. So when is the bottom? When is the perfect storm created by the subprime cash crunch at an end? Figure 1 is the Standard & Poor's 500, and more as a guide to look at each individual sector than as reality. |

|
| FIGURE 1: S&P 500, WEEKLY. So when is the bottom due? |
| Graphic provided by: AdvancedGET. |
| |
| Figure 1 is a weekly chart of the S&P 500. Previously, I have argued, using the monthly chart, that a correction was due, in that the index was retracing a B wave in an ABC correction. Because B waves are unpredictable in their rise, I was continually changing my target to the extent where I eventually argued that perhaps I was wrong and that the chart could be tracing a wave V. I have shown both wave counts on the chart, but the recent market meltdown suggests that the index truly retraced a B wave, which is now complete, and that the Index has started its C wave fall, which will be in five impulse waves. One difference, though — because the B wave tested the wave V high, the C wave bottom will not be as deep or as severe as it normally should be. In my chart I have shown where the low of C wave could be, namely the low of the A wave at 814. I have chosen this level simply because of the height reached by the B wave — but the C wave could well be a flat, and end at any level above this figure. Do note that the relative strength index (RSI) still has some way to fall before giving a buy signal. |
| In addition, do note the time suggested for the completion of the C wave. I have shown the 1.382% date and the 1.5% date of the rise from October 1974 to July 2000. The 1.382% is my date of choice for a bottom, namely April 30, 2010. So is the current meltdown the first drop of blood? Possibly, but that blood should be ankle-deep before this correction is over. |
Has been a technical analyst since 1969, and has worked as a futures and options trader with First Financial Futures in Johannesburg, South Africa.
| Address: | 3256 West 24th Ave |
| Vancouver, BC | |
| Phone # for sales: | 6042634214 |
| E-mail address: | petroosp@gmail.com |
Click here for more information about our publications!
Comments
Date: 08/23/07Rank: Comment: Good article, but the graphic is too small. Can t really ID the points on the graph very well that correspond to the text.

Request Information From Our Sponsors
- StockCharts.com, Inc.
- Candle Patterns
- Candlestick Charting Explained
- Intermarket Technical Analysis
- John Murphy on Chart Analysis
- John Murphy's Chart Pattern Recognition
- John Murphy's Market Message
- MurphyExplainsMarketAnalysis-Intermarket Analysis
- MurphyExplainsMarketAnalysis-Visual Analysis
- StockCharts.com
- Technical Analysis of the Financial Markets
- The Visual Investor
- VectorVest, Inc.
- Executive Premier Workshop
- One-Day Options Course
- OptionsPro
- Retirement Income Workshop
- Sure-Fire Trading Systems (VectorVest, Inc.)
- Trading as a Business Workshop
- VectorVest 7 EOD
- VectorVest 7 RealTime/IntraDay
- VectorVest AutoTester
- VectorVest Educational Services
- VectorVest OnLine
- VectorVest Options Analyzer
- VectorVest ProGraphics v6.0
- VectorVest ProTrader 7
- VectorVest RealTime Derby Tool
- VectorVest Simulator
- VectorVest Variator
- VectorVest Watchdog
