HOT TOPICS LIST
- MACD
- Fibonacci
- RSI
- Gann
- ADXR
- Stochastics
- Volume
- Triangles
- Futures
- Cycles
- Volatility
- ZIGZAG
- MESA
- Retracement
- Aroon
INDICATORS LIST
LIST OF TOPICS
PRINT THIS ARTICLE
by Chaitali Mohile
Ford is standing on strong historical support. The stock seem capable of undergoing any volatile action in the market.
Position: N/A
Chaitali Mohile
Active trader in the Indian stock markets since 2003 and a full-time writer. Trading is largely based upon technical analysis.
PRINT THIS ARTICLE
SUPPORT & RESISTANCE
Ford Motor Is Ready To Weather The Storm
08/17/07 02:42:35 PMby Chaitali Mohile
Ford is standing on strong historical support. The stock seem capable of undergoing any volatile action in the market.
Position: N/A
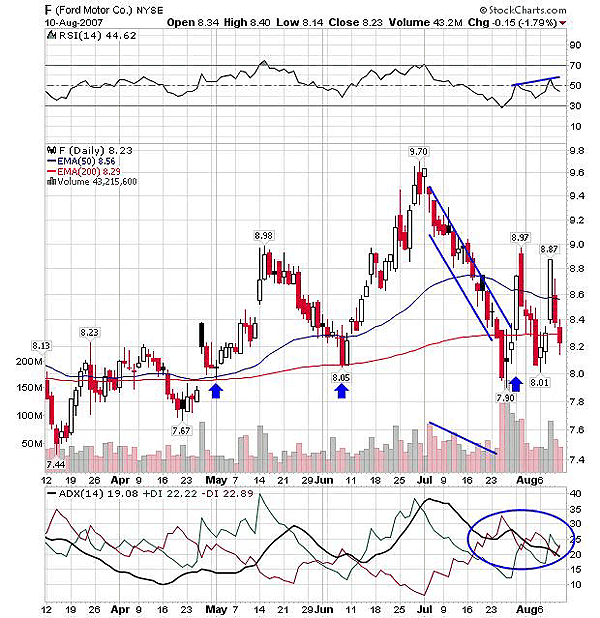
| In Figure 1, Ford Motor (F) has established strong support on the 200-day exponential moving average (EMA) after a drop from the $9.70 level. The entire fall gives the view of a falling wedge with diminishing volume. The short side was stronger initially during the fall but reduced further as the correction went deeper and the 200-EMA support turned to resistance. The falling wedge is a bullish indication. The price moved above the 200-day EMA and the 50-day EMA, but failed to continue the bullish rally ahead. Thereafter, the stock retraced twice to the 200-day EMA, making the support stronger. |
| History shows that bulls gathered strength at the 200-day EMA to carry the rally further. Given that, the present rally is likely to get support. Since price is moving in the range of $8 to $9 and also closer to its historical support, it seems the stock is bottoming out after the decline. The volatility remains constant in the financial market after the correction, so I think Ford is accumulating bullish strength to weather any coming storm. |

|
| FIGURE 1: FORD MOTOR, DAILY. Ford seems to be bottoming out at A strong support level after a crash. |
| Graphic provided by: StockCharts.com. |
| |
| The relative strength index (RSI) (14) has been moving in between the 70–30 level with equal bullish and bearish strength. Usually, buying comes in as the RSI (14) crosses the 50 level from below, but in this case buying started with the 30 level when the price surged with the 200-day EMA. The RSI (14) currently is gaining bullish strength, with positive divergence to an expected upward rally on the price chart. The average directional movement index (ADX) (14) has declined after a strong uptrend in early July with +DI ruling. Though the ADX (14) has not declined below 20, buying pressure has lost steam. The positive directional index (+DI) and the negative directional index (-DI) are moving close enough. The ADX (14) thus indicates the possibility of consolidation with no ruling trend. So both indicators are supporting my judgment of bottoming out. |

|
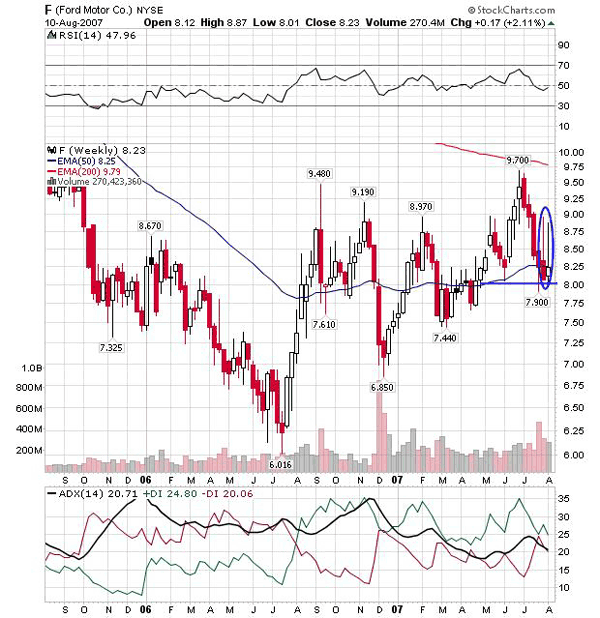
| FIGURE 2: FORD MOTOR, WEEKLY. Ford Motor stands on significant support and under 50-day EMA pressure. |
| Graphic provided by: StockCharts.com. |
| |
| In Figure 2, you can see there is strong resistance at the 200-day EMA at the $9.70 level, which hammered the price. Ford has closed under the 50-day EMA resistance for the previous week. During the week, the stock traded in the range of $8.97 to $8 but closed wildly below the high. The longer upper shadow indicates profit-taking due to lack of confidence amongst traders. The RSI (14) shows bullish strength to begin the rally above the 50-day EMA. The ADX (14) has made lower highs with +DI above -DI indicating bullish pressure. The ADX (14) has maintained the 20 level and thus indicates a developing uptrend. The indicators on the weekly chart are bullish too. |
| The big picture on the charts shows a much more bullish scenario. Ford is equally strong if it comes under the volatility clouds. |
Active trader in the Indian stock markets since 2003 and a full-time writer. Trading is largely based upon technical analysis.
| Company: | Independent |
| Address: | C1/3 Parth Indraprasth Towers. Vastrapur |
| Ahmedabad, Guj 380015 | |
| E-mail address: | chaitalimohile@yahoo.co.in |
Traders' Resource Links | |
| Independent has not added any product or service information to TRADERS' RESOURCE. | |
Click here for more information about our publications!
PRINT THIS ARTICLE

Request Information From Our Sponsors
- StockCharts.com, Inc.
- Candle Patterns
- Candlestick Charting Explained
- Intermarket Technical Analysis
- John Murphy on Chart Analysis
- John Murphy's Chart Pattern Recognition
- John Murphy's Market Message
- MurphyExplainsMarketAnalysis-Intermarket Analysis
- MurphyExplainsMarketAnalysis-Visual Analysis
- StockCharts.com
- Technical Analysis of the Financial Markets
- The Visual Investor
- VectorVest, Inc.
- Executive Premier Workshop
- One-Day Options Course
- OptionsPro
- Retirement Income Workshop
- Sure-Fire Trading Systems (VectorVest, Inc.)
- Trading as a Business Workshop
- VectorVest 7 EOD
- VectorVest 7 RealTime/IntraDay
- VectorVest AutoTester
- VectorVest Educational Services
- VectorVest OnLine
- VectorVest Options Analyzer
- VectorVest ProGraphics v6.0
- VectorVest ProTrader 7
- VectorVest RealTime Derby Tool
- VectorVest Simulator
- VectorVest Variator
- VectorVest Watchdog
