HOT TOPICS LIST
- MACD
- Fibonacci
- RSI
- Gann
- ADXR
- Stochastics
- Volume
- Triangles
- Futures
- Cycles
- Volatility
- ZIGZAG
- MESA
- Retracement
- Aroon
INDICATORS LIST
LIST OF TOPICS
PRINT THIS ARTICLE
by Chaitali Mohile
The bullish rally is blocked with an advance block candlestick pattern in PowerShares QQQ Trust.
Position: N/A
Chaitali Mohile
Active trader in the Indian stock markets since 2003 and a full-time writer. Trading is largely based upon technical analysis.
PRINT THIS ARTICLE
CANDLESTICK CHARTING
Advance Block In QQQQ
08/17/07 01:41:25 PMby Chaitali Mohile
The bullish rally is blocked with an advance block candlestick pattern in PowerShares QQQ Trust.
Position: N/A
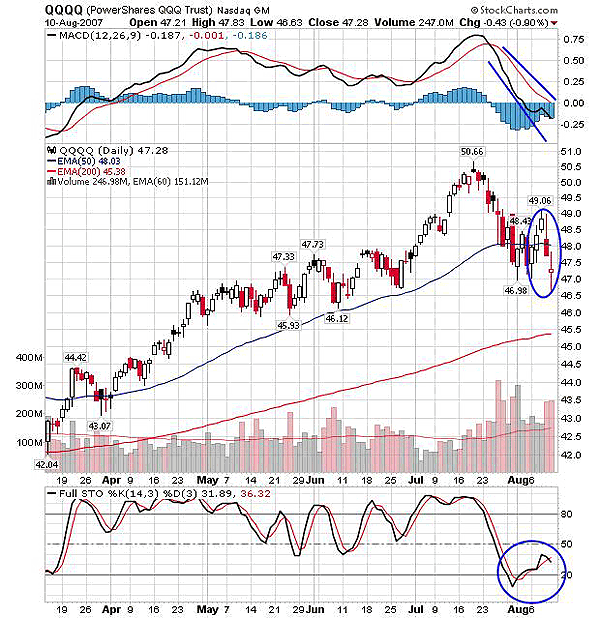
| An advance block is a bearish reversal candlestick pattern that appears in an uptrend. This pattern is a derivation of three white soldiers. In Figure 1, QQQQ was attempting a bullish rally from the $47 level, which is below the 50-day exponential moving average (EMA). The first candle in the circle is very bullish with a smaller upper shadow; the second and third candles were bullish as well, but the upper shadows are much longer, showing weakness in the rally. This action makes the pattern different from the three white soldiers. The basic difference in the two patterns is that advance block appears in an uptrend, while the soldiers pattern appears in a downtrend. In addition, in three white soldiers all the three candles end close to their days' highs, whereas here the second and third candles fail to close near a high, indicating nervous participants. |
| In Figure 1, QQQQ started a downward move at $50.66. This negative momentum came up with the entire market slump; otherwise, the uptrend in the stock was sustained. The loss of $4 on the rally does not turn an uptrend to down, and the QQQQ began its bullish move, violating the 50-day EMA resistance. Overall weaknesses in the entire market followed by global turbulence weakened the first pullback in the stock. QQQQ started a second upward rally from the same support of $46.98 with good bullish strength initially, but the second day and the third witnessed some profit-taking near the the extremes of two trading sessions. The profit-taking action shows losing bullish power. |

|
| FIGURE 1: QQQQ, DAILY. Due to the advance block in the uptrend, the bullish retraced back to its low pivot. |
| Graphic provided by: StockCharts.com. |
| |
| Advance block has already shown its effect. Leaving behind a 50-day EMA support, QQQQ dipped below $46.98. To identify the future direction, refer to the moving average convergence/divergence (MACD) (12, 26, 9) and the stochastic (14, 3, 3). The MACD (12, 26, 9) is highly negative after its bearish crossover at the end of July. Currently, the indicator has also moved below its zero line, pouring weakness into the rally. The histogram has continued below the zero line. The stochastic (14,3,3) was overbought when the price was hovering near the $50 level. The price nosedived, carrying the stochastic (14, 3, 3) to the oversold area. The advance block pattern stopped this upward trip from the oversold position and the indicator had to turn back. So currently, both indicators have a bearish indication. |
| With the bearish scenario on the chart, Power Shares QQQ Trust is likely to see more downside. Support levels like $46 and the 200-day EMA should be observed. |
Active trader in the Indian stock markets since 2003 and a full-time writer. Trading is largely based upon technical analysis.
| Company: | Independent |
| Address: | C1/3 Parth Indraprasth Towers. Vastrapur |
| Ahmedabad, Guj 380015 | |
| E-mail address: | chaitalimohile@yahoo.co.in |
Traders' Resource Links | |
| Independent has not added any product or service information to TRADERS' RESOURCE. | |
Click here for more information about our publications!
Comments

Request Information From Our Sponsors
- StockCharts.com, Inc.
- Candle Patterns
- Candlestick Charting Explained
- Intermarket Technical Analysis
- John Murphy on Chart Analysis
- John Murphy's Chart Pattern Recognition
- John Murphy's Market Message
- MurphyExplainsMarketAnalysis-Intermarket Analysis
- MurphyExplainsMarketAnalysis-Visual Analysis
- StockCharts.com
- Technical Analysis of the Financial Markets
- The Visual Investor
- VectorVest, Inc.
- Executive Premier Workshop
- One-Day Options Course
- OptionsPro
- Retirement Income Workshop
- Sure-Fire Trading Systems (VectorVest, Inc.)
- Trading as a Business Workshop
- VectorVest 7 EOD
- VectorVest 7 RealTime/IntraDay
- VectorVest AutoTester
- VectorVest Educational Services
- VectorVest OnLine
- VectorVest Options Analyzer
- VectorVest ProGraphics v6.0
- VectorVest ProTrader 7
- VectorVest RealTime Derby Tool
- VectorVest Simulator
- VectorVest Variator
- VectorVest Watchdog
