

HOT TOPICS LIST
- MACD
- Fibonacci
- RSI
- Gann
- ADXR
- Stochastics
- Volume
- Triangles
- Futures
- Cycles
- Volatility
- ZIGZAG
- MESA
- Retracement
- Aroon
INDICATORS LIST
LIST OF TOPICS
PRINT THIS ARTICLE
by Arthur Hill
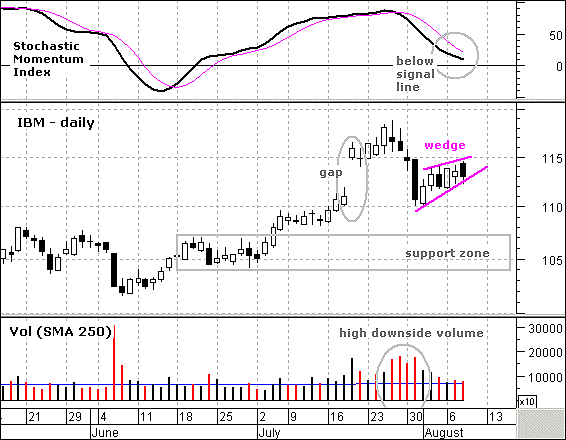
A filled gap and bearish wedge look ominous for Big Blue. A breakdown from here would target further weakness toward the next support level.
Position: Sell
Arthur Hill
Arthur Hill is currently editor of TDTrader.com, a website specializing in trading strategies, sector/industry specific breadth stats and overall technical analysis. He passed the Society of Technical Analysts (STA London) diploma exam with distinction is a Certified Financial Technician (CFTe). Prior to TD Trader, he was the Chief Technical Analyst for Stockcharts.com and the main contributor to the ChartSchool.
PRINT THIS ARTICLE
WEDGE FORMATIONS
A Bearish Wedge For IBM
08/10/07 11:50:10 AMby Arthur Hill
A filled gap and bearish wedge look ominous for Big Blue. A breakdown from here would target further weakness toward the next support level.
Position: Sell
| On the daily chart (Figure 1), IBM led the market higher during June and July with a surge to new highs at the end of July. This surge featured a big gap above 115, and this gap held for over a week. However, the stock did not follow through on the gap and consolidated instead. The early August decline filled the gap and this is now looking like an exhaustion gap. As that name suggests, this signals exhaustion of the uptrend and points to at least a correction. |
|
| FIGURE 1: IBM, DAILY. IBM led the market higher during June and July with a surge to new highs at the end of July. |
| Graphic provided by: MetaStock. |
| |
| The late July and early August decline occurred on high volume, and the stock bounced with a rising wedge on low volume. The volume combination clearly shows that sellers are dominant over the last 10 days. The low volume advance reflects weak buying pressure, and this is typical for a corrective advance. The rising wedge pattern is also typical for a corrective advance, and a break below 112 would signal a continuation of the prior decline. The downside target would be support around 105–107 (gray box). |
| Momentum has already turned lower, and this also favors a support break. The top indicator shows the 20-period stochastic momentum oscillator. This indicator measures the level of the close relative to the midpoint of the high–low range over the last 20-period (closing high and closing low). It is used like a normal momentum oscillator, and the indicator turned lower with a move below its signal line in late July. Despite the rising wedge, the indicator remains below its signal line and this tells me that momentum currently favors bears. A move above the signal line would be positive for momentum and call for a reassessment of the wedge setup. |
Arthur Hill is currently editor of TDTrader.com, a website specializing in trading strategies, sector/industry specific breadth stats and overall technical analysis. He passed the Society of Technical Analysts (STA London) diploma exam with distinction is a Certified Financial Technician (CFTe). Prior to TD Trader, he was the Chief Technical Analyst for Stockcharts.com and the main contributor to the ChartSchool.
| Title: | Editor |
| Company: | TDTrader.com |
| Address: | Willem Geetsstraat 17 |
| Mechelen, B2800 | |
| Phone # for sales: | 3215345465 |
| Website: | www.tdtrader.com |
| E-mail address: | arthurh@tdtrader.com |
Traders' Resource Links | |
| TDTrader.com has not added any product or service information to TRADERS' RESOURCE. | |
Click here for more information about our publications!
PRINT THIS ARTICLE

Request Information From Our Sponsors
- StockCharts.com, Inc.
- Candle Patterns
- Candlestick Charting Explained
- Intermarket Technical Analysis
- John Murphy on Chart Analysis
- John Murphy's Chart Pattern Recognition
- John Murphy's Market Message
- MurphyExplainsMarketAnalysis-Intermarket Analysis
- MurphyExplainsMarketAnalysis-Visual Analysis
- StockCharts.com
- Technical Analysis of the Financial Markets
- The Visual Investor
- VectorVest, Inc.
- Executive Premier Workshop
- One-Day Options Course
- OptionsPro
- Retirement Income Workshop
- Sure-Fire Trading Systems (VectorVest, Inc.)
- Trading as a Business Workshop
- VectorVest 7 EOD
- VectorVest 7 RealTime/IntraDay
- VectorVest AutoTester
- VectorVest Educational Services
- VectorVest OnLine
- VectorVest Options Analyzer
- VectorVest ProGraphics v6.0
- VectorVest ProTrader 7
- VectorVest RealTime Derby Tool
- VectorVest Simulator
- VectorVest Variator
- VectorVest Watchdog