HOT TOPICS LIST
- MACD
- Fibonacci
- RSI
- Gann
- ADXR
- Stochastics
- Volume
- Triangles
- Futures
- Cycles
- Volatility
- ZIGZAG
- MESA
- Retracement
- Aroon
INDICATORS LIST
LIST OF TOPICS
PRINT THIS ARTICLE
by Paolo Pezzutti
The stock finds an important support in the $60 area and outperforms the DJ Investment Services Index.
Position: N/A
Paolo Pezzutti
Author of the book "Trading the US Markets - A Comprehensive Guide to US Markets for International Traders and Investors" - Harriman House (July 2008)
PRINT THIS ARTICLE
TECHNICAL ANALYSIS
Morgan Stanley Price Finds Support
08/09/07 11:17:21 AMby Paolo Pezzutti
The stock finds an important support in the $60 area and outperforms the DJ Investment Services Index.
Position: N/A
| Morgan Stanley (MS) together with the DJ Investment Services (DJUSSB) Index finally printed a consistent rebound on Wednesday session. Stocks plunged last Friday after Bear Stearns (BSC) commented about credit markets and exacerbated mortgage worries. Standard & Poor's lowered its outlook on Bear Stearns' debt to "negative," saying the biggest US underwriter of mortgage bonds may have problems. The investment services sector in general suffered major losses with Morgan Stanley (MS), Merrill Lynch (MER), Goldman Sachs (GS), and Lehman Brothers (LEH). Analysts were expecting and monitoring emerging markets as the trigger to a correction or a bear market to come. During the past months we heard several times that the fragile, illiquid markets of the emerging economies were to lead a general retreat of the indexes. Instead, domestic US issues due to credit tightening triggered the fast down move that we are experiencing. Markets tend to take investors by surprise. Some stocks have reached the levels printed at the end of 2005, losing about 30% off their top. Some companies have even undermined their medium-term uptrend. Morgan Stanley is trying to hold its support levels, outperforming the DJ Investment Services Index. |

|
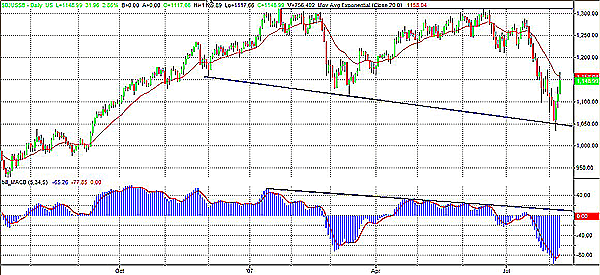
| FIGURE 1: DJ INVESTMENT SERVICES. The DJ Investment Services Index has found support on a descending trendline after printing a lower low. |
| Graphic provided by: TradeStation. |
| |
| In Figure 1, you can see the daily chart of the index; 1300 represented a key resistance level. The moving average convergence/divergence (MACD) indicator has developed significant negative divergences during the last leg of the uptrend. Prices have now shown an important support on a descending trendline. Note that the MACD has also shown a new low, indicating that momentum to the downside is very high. |

|
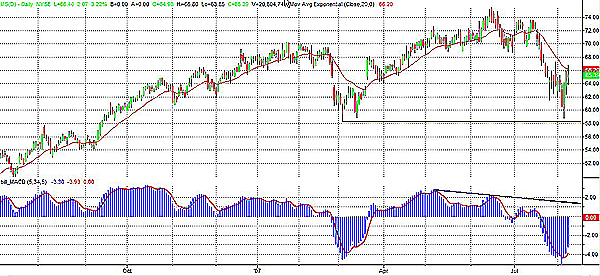
| FIGURE 2: MORGAN STANLEY. Morgan Stanley is outperforming the index, as the correction has not managed to bring prices below the previous low. |
| Graphic provided by: TradeStation. |
| |
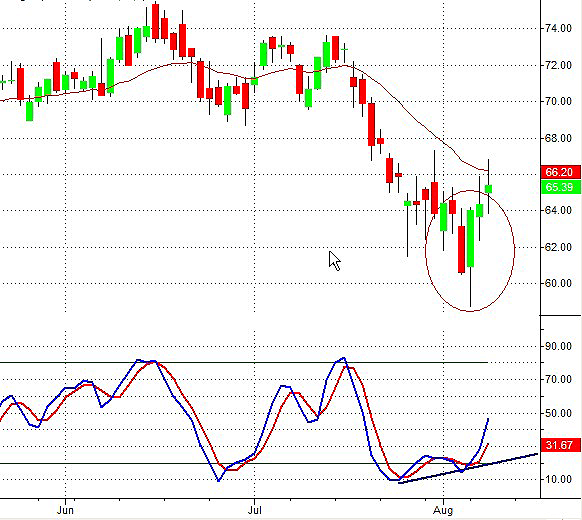
| In Figure 2, Morgan Stanley displays a different condition. It has printed a new high in June, reaching the $75 level. On August 6, it has shown a low at about the same level of the March pivot point. The very big engulfing pattern that you can see in Figure 3 is characterized by a wide-ranging bar to the upside. This indicates that buyers have entered new positions at support. The stochastic slow has developed a positive divergence coinciding with the engulfing pattern. This pattern often sustains at least short-term reactions. |

|
| FIGURE 3: ENGULFING PATTERN. An engulfing associated to a positive divergence of the stochastic slow has initiated a short-term rebound, bringing prices to the first resistance level after three consecutive up days. |
| Graphic provided by: TradeStation. |
| |
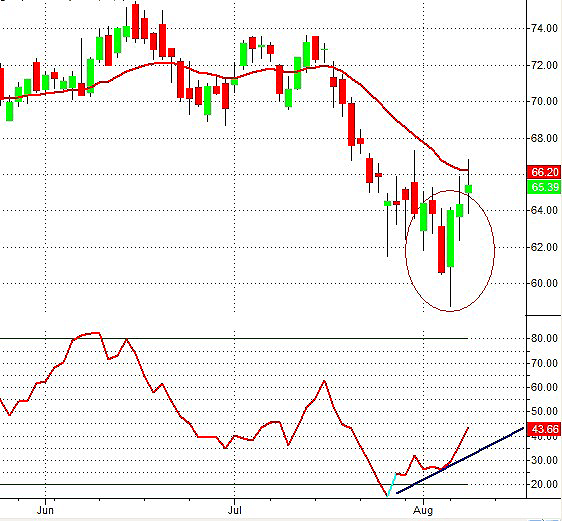
| The same pattern can be noted in Figure 4, where the money flow also displays a positive divergence. Positive money flow (when the current bar's average price exceeds the previous bar's average price) is calculated by multiplying the current bar's volume and its average price. The positive money flows are then summed over a specified number of bars and divided by the sum of all the money flows printed during the same period. The use of both price and volume provides an interesting perspective. The indicator oscillates between overbought and oversold conditions and divergences can be used to spot potential reversal points. The rebound has now reached the descending 20-day moving average. |

|
| FIGURE 4: MONEY FLOW. In addition, the money flow has printed a positive divergence in coincidence with the low. |
| Graphic provided by: TradeStation. |
| |
| In the short term, I would not open a long position in this situation. Prices have now reached a resistance level after three consecutive up days. With the MACD hitting new lows, I would expect to see how the stock reacts to a new tentative move to the downside in order to assess the strength of its support level in the $60 area. As the stock is outperforming the Investment Services Index, this relative strength makes Morgan Stanley a candidate for long positions should the support hold. To the upside the next resistance is identified in the $69 area. To the downside the breakout of the $60 support would open a much longer negative phase. |
Author of the book "Trading the US Markets - A Comprehensive Guide to US Markets for International Traders and Investors" - Harriman House (July 2008)
| Address: | VIA ROBERTO AGO 26 POSTAL CODE 00166 |
| Rome, ITALY | |
| Phone # for sales: | +393357540708 |
| E-mail address: | pezzutti.paolo@tiscali.it |
Click here for more information about our publications!
PRINT THIS ARTICLE

Request Information From Our Sponsors
- StockCharts.com, Inc.
- Candle Patterns
- Candlestick Charting Explained
- Intermarket Technical Analysis
- John Murphy on Chart Analysis
- John Murphy's Chart Pattern Recognition
- John Murphy's Market Message
- MurphyExplainsMarketAnalysis-Intermarket Analysis
- MurphyExplainsMarketAnalysis-Visual Analysis
- StockCharts.com
- Technical Analysis of the Financial Markets
- The Visual Investor
- VectorVest, Inc.
- Executive Premier Workshop
- One-Day Options Course
- OptionsPro
- Retirement Income Workshop
- Sure-Fire Trading Systems (VectorVest, Inc.)
- Trading as a Business Workshop
- VectorVest 7 EOD
- VectorVest 7 RealTime/IntraDay
- VectorVest AutoTester
- VectorVest Educational Services
- VectorVest OnLine
- VectorVest Options Analyzer
- VectorVest ProGraphics v6.0
- VectorVest ProTrader 7
- VectorVest RealTime Derby Tool
- VectorVest Simulator
- VectorVest Variator
- VectorVest Watchdog
