

HOT TOPICS LIST
- MACD
- Fibonacci
- RSI
- Gann
- ADXR
- Stochastics
- Volume
- Triangles
- Futures
- Cycles
- Volatility
- ZIGZAG
- MESA
- Retracement
- Aroon
INDICATORS LIST
LIST OF TOPICS
PRINT THIS ARTICLE
by David Penn
Maybe "great" is a little much. But Wal-Mart is rallying alongside its retail brethern and taking advantage of the new interest rate environment.
Position: N/A
David Penn
Technical Writer for Technical Analysis of STOCKS & COMMODITIES magazine, Working-Money.com, and Traders.com Advantage.
PRINT THIS ARTICLE
TECHNICAL ANALYSIS
Wal-Mart and the Great Retail Recovery
01/10/01 10:04:01 AMby David Penn
Maybe "great" is a little much. But Wal-Mart is rallying alongside its retail brethern and taking advantage of the new interest rate environment.
Position: N/A
| With the poor holiday sales a recent memory for many, it may sound insane to suggest that retail stocks--one month later--are becoming good buys. In fact, it is interesting to imagine the transmogrifications a retail bear in December might have to undergo in order to become a retail bull in January. Fortunately for technical analysts, the only shape-shifting we are concerned about occurs on charts. And the charts are suggesting that retail stocks (?!) may be on the move. |
| Retail stocks are under the spotlight because they are part of the consumer cyclical sector that is often the first to respond to interest rate changes as instigated by the Federal Reserve Board. As others have pointed out, retail stocks were hard hit going into the season of rate tightening (roughly from mid-1999 to mid-2000) and are often among the first to advance when the Fed makes a policy shift in favor of softer money. Hoping to find those retail stocks whose capitalization and wide ownership make them likely to benefit the most from a lower interest rate environment, I found Wal-Mart to be an interesting example of what might be in store for the cream of the retail crop. |
|
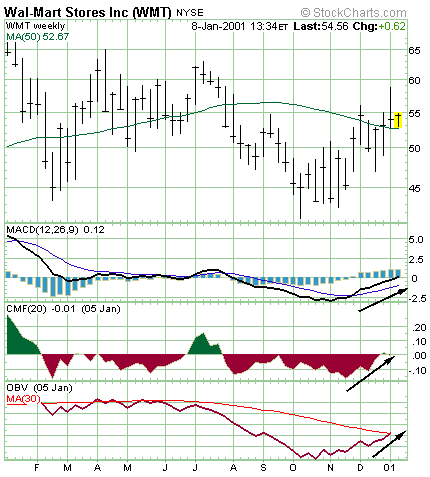
| On-balance volume, money flow and MACD are all poised for upside moves. Money flow and MACD are headed for positive territory for the first time in months. |
| Graphic provided by: StockCharts.com. |
| |
| Wal-Mart spent much of 2000 in a pair of trading ranges: a spring range from the low 60s to the low 50s, and a fall range from the low 50s to the low 40s. With shares trending lower over 2000, it is no surprise to see the negatives in money flow and on-balance volume on the weekly Wal-Mart chart below. After a brief summer rally, shares of Wal-Mart came under strong selling pressure in August and September, marking year-to-date lows. But from those October lows Wal-Mart has rallied 10% to end the year just under 55. |
| Thus, Wal-Mart was already in a rally mode when the Federal Reserve Board began cutting interest rates last week. The rally is especially clear when seen through the on-balance volume and money flow indicators. In terms of on-balance volume, Wal-Mart has seen its trend bottom-out in mid-October and reverse to the upside, where it continues to hold. After a year of largely negative money flow, Wal-Mart is seeing the beginning of a trend reversal to the upside here in January as well. Lastly, Wal-Mart's moving average convergence divergence (MACD) indicator is also becoming bullish--perhaps more so than at any time in 2000. Again, Wal-Mart's MACD is moving from negative territory to positive territory in January after a bullish MACD crossover in late November. |
| Most of these indicators for Wal-Mart are in "pre-breakout" positions, with both the MACD and the money flow indicator poised to move into positive territory for the first time since the summer of 2000, and on-balance volume about to move upside of its 30-day moving average for the first time in months. This, of course, suggests both significant potential and significant risk. But for those interested in catching some of these retail stocks at a point that may represent the bottom of a significant move, "pre-breakout" positions are exactly what must be studied. I should add that a few other stocks in the retail area have similar "pre-breakout" charts that are worthy of consideration. Foremost among them are Kohl's (KSS), Target Corporation (TGT) and Costco Wholesale (COST). |
Technical Writer for Technical Analysis of STOCKS & COMMODITIES magazine, Working-Money.com, and Traders.com Advantage.
| Title: | Technical Writer |
| Company: | Technical Analysis, Inc. |
| Address: | 4757 California Avenue SW |
| Seattle, WA 98116 | |
| Phone # for sales: | 206 938 0570 |
| Fax: | 206 938 1307 |
| Website: | www.Traders.com |
| E-mail address: | DPenn@traders.com |
Traders' Resource Links | |
| Charting the Stock Market: The Wyckoff Method -- Books | |
| Working-Money.com -- Online Trading Services | |
| Traders.com Advantage -- Online Trading Services | |
| Technical Analysis of Stocks & Commodities -- Publications and Newsletters | |
| Working Money, at Working-Money.com -- Publications and Newsletters | |
| Traders.com Advantage -- Publications and Newsletters | |
| Professional Traders Starter Kit -- Software | |
Click here for more information about our publications!
Comments

Request Information From Our Sponsors
- StockCharts.com, Inc.
- Candle Patterns
- Candlestick Charting Explained
- Intermarket Technical Analysis
- John Murphy on Chart Analysis
- John Murphy's Chart Pattern Recognition
- John Murphy's Market Message
- MurphyExplainsMarketAnalysis-Intermarket Analysis
- MurphyExplainsMarketAnalysis-Visual Analysis
- StockCharts.com
- Technical Analysis of the Financial Markets
- The Visual Investor
- VectorVest, Inc.
- Executive Premier Workshop
- One-Day Options Course
- OptionsPro
- Retirement Income Workshop
- Sure-Fire Trading Systems (VectorVest, Inc.)
- Trading as a Business Workshop
- VectorVest 7 EOD
- VectorVest 7 RealTime/IntraDay
- VectorVest AutoTester
- VectorVest Educational Services
- VectorVest OnLine
- VectorVest Options Analyzer
- VectorVest ProGraphics v6.0
- VectorVest ProTrader 7
- VectorVest RealTime Derby Tool
- VectorVest Simulator
- VectorVest Variator
- VectorVest Watchdog