HOT TOPICS LIST
- MACD
- Fibonacci
- RSI
- Gann
- ADXR
- Stochastics
- Volume
- Triangles
- Futures
- Cycles
- Volatility
- ZIGZAG
- MESA
- Retracement
- Aroon
INDICATORS LIST
LIST OF TOPICS
PRINT THIS ARTICLE
by David Penn
A diamond breakout in September wheat begins another leg higher.
Position: N/A
David Penn
Technical Writer for Technical Analysis of STOCKS & COMMODITIES magazine, Working-Money.com, and Traders.com Advantage.
PRINT THIS ARTICLE
THE DIAMOND
The Wheat Diamond
08/08/07 12:19:23 PMby David Penn
A diamond breakout in September wheat begins another leg higher.
Position: N/A
| Been dying for analysis of the wheat futures market? I wouldn't be surprised if so. The last time wheat futures were discussed in any length at Traders.com Advantage was an article I wrote back in 2003 about a double top. That call proved incorrect insofar as a brief shallow breakdown only provided a low from which a strong bull market in wheat futures emerged. So you could say that September wheat and I had a score to settle. This time, in contrast to my bearishness on wheat futures four years ago, a diamond consolidation in an uptrending market has led, unsurprisingly perhaps, to a breakout to the upside. |
| While not a hard and fast rule, consolidations in trends tend to lead to more trend rather than to reversal. Spotting this diamond pattern developing — and recognizing a general inflationary bias to the commodity markets — I had a fairly easy time anticipating an upside resolution to September wheat's late June–early July consolidation. |

|
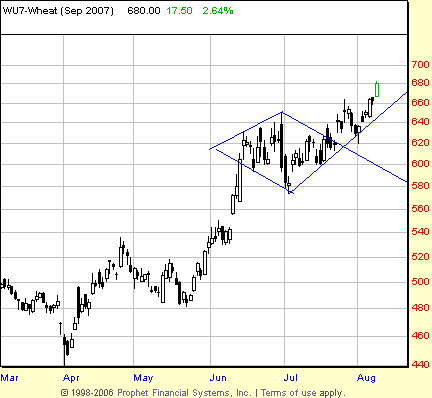
| FIGURE 1: WHEAT, SEPTEMBER FUTURES, DAILY. The breakout from this diamond pattern set September wheat on a course for a possible test of the $7 level. |
| Graphic provided by: Prophet Financial, Inc. |
| |
| The pattern features the requisite pair of parallel lines to provide both support and resistance on the right side of the channel. Diamond patterns are similar in behavior to symmetrical triangles in that breaks from these patterns can move upward or downward. As such, traders and technicians like Thomas Bulkowski, author of Encyclopedia Of Chart Patterns, encourage traders to wait for the market to show its hand with a break before taking a position. |
| In the case of September wheat shown in Figure 1, the breakout was to the upside, even though the session itself was down and ended up closing back inside the consolidation. The following day was more of the same, only lower. The third day was lower still, though still barely within the upper right resistance boundary of the diamond. The fourth day was a charm, as September wheat broke free from that upper right resistance boundary. Not only that, but the market closed above 640, marking a new multimonth high. |
| How much more upside might September wheat have? The diamond pattern, minimizing the shadows somewhat, is approximately 60 points at its widest. Adding this number to the value at the breakout point of approximately 620 gives us a projected upside minimum of 680. |
Technical Writer for Technical Analysis of STOCKS & COMMODITIES magazine, Working-Money.com, and Traders.com Advantage.
| Title: | Technical Writer |
| Company: | Technical Analysis, Inc. |
| Address: | 4757 California Avenue SW |
| Seattle, WA 98116 | |
| Phone # for sales: | 206 938 0570 |
| Fax: | 206 938 1307 |
| Website: | www.Traders.com |
| E-mail address: | DPenn@traders.com |
Traders' Resource Links | |
| Charting the Stock Market: The Wyckoff Method -- Books | |
| Working-Money.com -- Online Trading Services | |
| Traders.com Advantage -- Online Trading Services | |
| Technical Analysis of Stocks & Commodities -- Publications and Newsletters | |
| Working Money, at Working-Money.com -- Publications and Newsletters | |
| Traders.com Advantage -- Publications and Newsletters | |
| Professional Traders Starter Kit -- Software | |
Click here for more information about our publications!
PRINT THIS ARTICLE

Request Information From Our Sponsors
- VectorVest, Inc.
- Executive Premier Workshop
- One-Day Options Course
- OptionsPro
- Retirement Income Workshop
- Sure-Fire Trading Systems (VectorVest, Inc.)
- Trading as a Business Workshop
- VectorVest 7 EOD
- VectorVest 7 RealTime/IntraDay
- VectorVest AutoTester
- VectorVest Educational Services
- VectorVest OnLine
- VectorVest Options Analyzer
- VectorVest ProGraphics v6.0
- VectorVest ProTrader 7
- VectorVest RealTime Derby Tool
- VectorVest Simulator
- VectorVest Variator
- VectorVest Watchdog
- StockCharts.com, Inc.
- Candle Patterns
- Candlestick Charting Explained
- Intermarket Technical Analysis
- John Murphy on Chart Analysis
- John Murphy's Chart Pattern Recognition
- John Murphy's Market Message
- MurphyExplainsMarketAnalysis-Intermarket Analysis
- MurphyExplainsMarketAnalysis-Visual Analysis
- StockCharts.com
- Technical Analysis of the Financial Markets
- The Visual Investor
