HOT TOPICS LIST
- MACD
- Fibonacci
- RSI
- Gann
- ADXR
- Stochastics
- Volume
- Triangles
- Futures
- Cycles
- Volatility
- ZIGZAG
- MESA
- Retracement
- Aroon
INDICATORS LIST
LIST OF TOPICS
PRINT THIS ARTICLE
by Chaitali Mohile
XLP moved smartly above resistance with strong support and heavy volume.
Position: Buy
Chaitali Mohile
Active trader in the Indian stock markets since 2003 and a full-time writer. Trading is largely based upon technical analysis.
PRINT THIS ARTICLE
TECHNICAL ANALYSIS
Consumer Staples Bounce Back
08/16/07 02:07:17 PMby Chaitali Mohile
XLP moved smartly above resistance with strong support and heavy volume.
Position: Buy
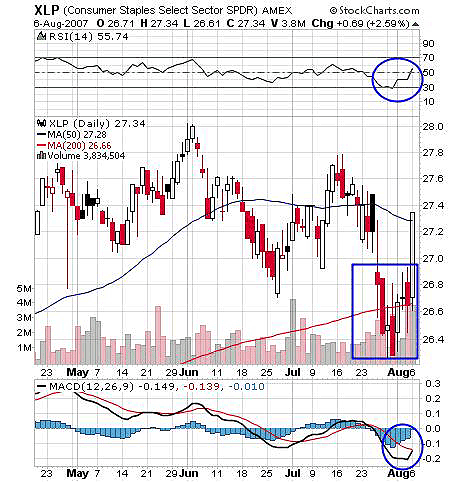
| Consumer Staples (XLP) moved in a zigzag fashion near the 200-day moving average support & resistance area during the past turbulence in the US financial markets. This high volatility is normal in an unstable market. The sector moved below the 50-day moving average (MA) and the 200-day MA support from highs, even though the 200-day MA support recovered hurriedly within a few days. This signifies the bullish strength in the sector relative to the plunge in the broader indexes. Monday's bounce in the entire US market rocked XLP as it moved vertically above the 50-day MA resistances. |

|
| FIGURE 1: XLP, DAILY. A close above the 50-day moving average resistance gave a bullish view to XLP. The 200-day moving average is a strong support for an upside rally. |
| Graphic provided by: StockCharts.com. |
| |
| The moving average convergence/divergence (MACD) (12,26,9) has been negative with a bearish crossover since the slide began. The upward journey began with the volatile rally from a low of 26. The rally established support on the 200-day moving average, and the MACD bullish crossover looks imminent now. The relative strength index (RSI)(14) has already moved in a bullish fashion above 30. The RSI (14) at 55 has technically created a fresh buying position. Thus, according to Figure 1, the bounce can be bought with the stop-loss of $26. But I would suggest more confirmation from indicators and price movement before any long position. The MACD (12,26,9) should give a confirmed bullish crossover, and the RSI (14) should sustain above 50 while the price held above 27.4 for a low-risk entry. |
| With an event day ahead and a previous crunch in the stock market, the above confirmation is of utmost importance for all traders. |

|
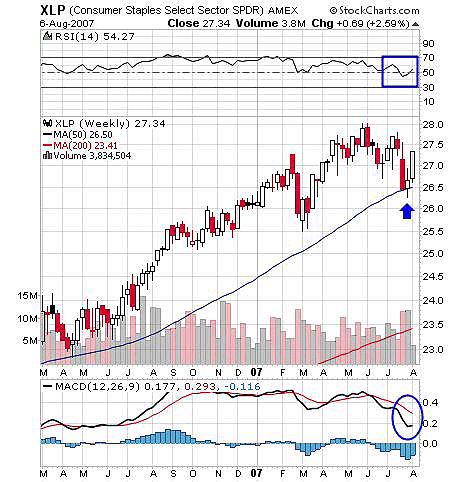
| FIGURE 2: XLP, WEEKLY. The RSI (14) has bullish strength to carry on the rally with a 50-day moving average support. |
| Graphic provided by: StockCharts.com. |
| |
| XLP made its all-time high at $28 in May with a bullish RSI (14) and positive MACD (12,26,9). The price moderately reacted to a new high and went through volatile trading. Turbulence in the entire market saw XLP plunging to a 50-day MA support. The price bounced on good volume after resting for two weeks in the same area. The bounce looks very strong on the weekly chart as well. The RSI (14) is stable at the 50 level in an unstable market strength. The MACD (12, 26,9) is in a positive area with a bearish crossover. Thus, on these positive notes, the bounce is likely to carry a bullish rally ahead. |
| For a lower risk, traders should be watchful for the confirmation on the daily chart. The bounce will first target the previous high of the Consumer Staples Select Sector. |
Active trader in the Indian stock markets since 2003 and a full-time writer. Trading is largely based upon technical analysis.
| Company: | Independent |
| Address: | C1/3 Parth Indraprasth Towers. Vastrapur |
| Ahmedabad, Guj 380015 | |
| E-mail address: | chaitalimohile@yahoo.co.in |
Traders' Resource Links | |
| Independent has not added any product or service information to TRADERS' RESOURCE. | |
Click here for more information about our publications!
PRINT THIS ARTICLE

Request Information From Our Sponsors
- VectorVest, Inc.
- Executive Premier Workshop
- One-Day Options Course
- OptionsPro
- Retirement Income Workshop
- Sure-Fire Trading Systems (VectorVest, Inc.)
- Trading as a Business Workshop
- VectorVest 7 EOD
- VectorVest 7 RealTime/IntraDay
- VectorVest AutoTester
- VectorVest Educational Services
- VectorVest OnLine
- VectorVest Options Analyzer
- VectorVest ProGraphics v6.0
- VectorVest ProTrader 7
- VectorVest RealTime Derby Tool
- VectorVest Simulator
- VectorVest Variator
- VectorVest Watchdog
- StockCharts.com, Inc.
- Candle Patterns
- Candlestick Charting Explained
- Intermarket Technical Analysis
- John Murphy on Chart Analysis
- John Murphy's Chart Pattern Recognition
- John Murphy's Market Message
- MurphyExplainsMarketAnalysis-Intermarket Analysis
- MurphyExplainsMarketAnalysis-Visual Analysis
- StockCharts.com
- Technical Analysis of the Financial Markets
- The Visual Investor
