HOT TOPICS LIST
- MACD
- Fibonacci
- RSI
- Gann
- ADXR
- Stochastics
- Volume
- Triangles
- Futures
- Cycles
- Volatility
- ZIGZAG
- MESA
- Retracement
- Aroon
INDICATORS LIST
LIST OF TOPICS
PRINT THIS ARTICLE
by Chaitali Mohile
The lower highs in price and the long-term moving average upside move formed a symmetrical triangle. The breakdown has forced the index to plunge. Will the freefall continue?
Position: N/A
Chaitali Mohile
Active trader in the Indian stock markets since 2003 and a full-time writer. Trading is largely based upon technical analysis.
PRINT THIS ARTICLE
TRIANGLES
Is Downside In Biotechnology Index Complete?
08/16/07 01:39:34 PMby Chaitali Mohile
The lower highs in price and the long-term moving average upside move formed a symmetrical triangle. The breakdown has forced the index to plunge. Will the freefall continue?
Position: N/A
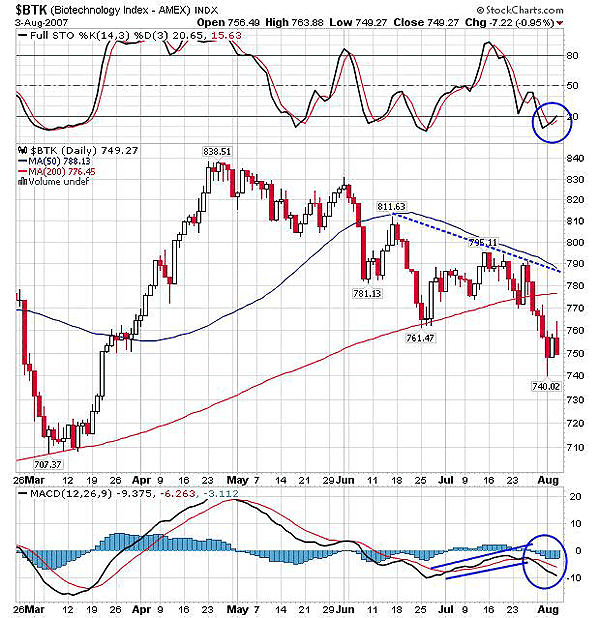
| The Biotechnology Index reached its all-time high in late April 2007 at 838. Then the declining rally on the index began forming lower highs with every smaller recovery. This rally itself was a bearish indication for a future correction, but it went unnoticed as there were few supports for the declining rally. In addition, the index had retraced from its all-time high, so the decline was absorbed easily till it hit the 50-day moving average support level. But the slump continued below the 50-day moving average, while the 200-day moving average moved upward. If you see Figure 1, you'll see a much larger symmetrical triangle formed with an upper resistance line from 838, whereas the 200-day moving average formed the lower support line of the triangle. Accordingly, 710 formed the lowest support of the previous advance rally to 838. |
| A more significant triangle was formed by the convergence of the 50-day and the 200-day moving average. Below 810, the 50-day moving average also turned downward along with the price restricting an upward rally and the 200-day moving average rallied upward. But the past turbulence in the US market pressurized the index to leave the 200-day moving average support, losing an additional 30 points. With the US Fed meeting ahead, traders really are left with last beat. Credit policies and many other concerns like housing rate and inflation will direct the market move. Only then will traders know if the Biotechnology Index will plunge more or begin its pullback rally. |

|
| FIGURE 1: $BTK, DAILY. The lowest level of 707 is likely to get tested if the plummet continues. |
| Graphic provided by: StockCharts.com. |
| |
| The index is consolidating at the 758-750 level for the last three days, while the lowest support below 750 stands at the 710 level. The stochastic (14, 3, 3) has bounced from lower support, but a definite trade can only be identified if the indicator moves above 20. The moving average convergence/divergence (MACD) (12, 26, 9) in early July had a bullish crossover, though in a negative area, the price witnessed an unstable bullish rally from 200-day moving average support to 50-day moving average resistance of the triangle. An immediate MACD (12, 26, 9) bearish crossover strengthened the shorts supporting the downside breakout of the triangle. |

|
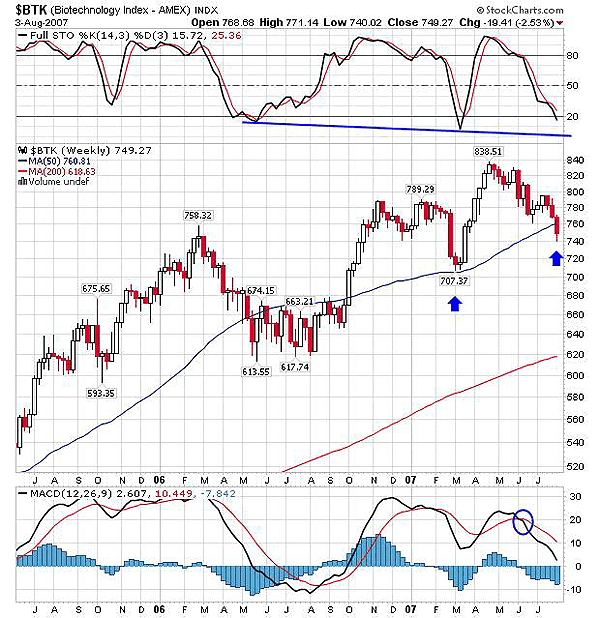
| FIGURE 2: $BTK, WEEKLY. The 50-day moving average support is turned to resistance with the previous week's closing. |
| Graphic provided by: StockCharts.com. |
| |
| In Figure 2, the last week's close turned the 50-day MA support into resistance. The previous bullish rally started with 50-day MA support at 707 level, accumulating greater strength near the support. Stochastic (14, 3, 3) is closer to the 20 level, but being an event day, the support at 20 cannot be overlooked. If the support is established here, stochastic may bounce back, creating a positive sign for long traders. The MACD (12, 26,9) remains negative and stable below the zero line. Therefore, indicators too don't show any specific direction. Thus, the Fed meeting decision may certainly direct the struggling financial markets. |
| If traders need to calculate the minimum level for triangular breakout in the daily chart, the width of triangle should be measured -- that is, 810 - 760 = 50 points, so 770 (breakdown level) - 50 = 720 will be the minimum level. The target is much closer to the lowest support of correction, and thus 720/710 range becomes the strong support if the slump continues. |
Active trader in the Indian stock markets since 2003 and a full-time writer. Trading is largely based upon technical analysis.
| Company: | Independent |
| Address: | C1/3 Parth Indraprasth Towers. Vastrapur |
| Ahmedabad, Guj 380015 | |
| E-mail address: | chaitalimohile@yahoo.co.in |
Traders' Resource Links | |
| Independent has not added any product or service information to TRADERS' RESOURCE. | |
Click here for more information about our publications!
Comments

Request Information From Our Sponsors
- StockCharts.com, Inc.
- Candle Patterns
- Candlestick Charting Explained
- Intermarket Technical Analysis
- John Murphy on Chart Analysis
- John Murphy's Chart Pattern Recognition
- John Murphy's Market Message
- MurphyExplainsMarketAnalysis-Intermarket Analysis
- MurphyExplainsMarketAnalysis-Visual Analysis
- StockCharts.com
- Technical Analysis of the Financial Markets
- The Visual Investor
- VectorVest, Inc.
- Executive Premier Workshop
- One-Day Options Course
- OptionsPro
- Retirement Income Workshop
- Sure-Fire Trading Systems (VectorVest, Inc.)
- Trading as a Business Workshop
- VectorVest 7 EOD
- VectorVest 7 RealTime/IntraDay
- VectorVest AutoTester
- VectorVest Educational Services
- VectorVest OnLine
- VectorVest Options Analyzer
- VectorVest ProGraphics v6.0
- VectorVest ProTrader 7
- VectorVest RealTime Derby Tool
- VectorVest Simulator
- VectorVest Variator
- VectorVest Watchdog
