HOT TOPICS LIST
- MACD
- Fibonacci
- RSI
- Gann
- ADXR
- Stochastics
- Volume
- Triangles
- Futures
- Cycles
- Volatility
- ZIGZAG
- MESA
- Retracement
- Aroon
INDICATORS LIST
LIST OF TOPICS
PRINT THIS ARTICLE
by Chaitali Mohile
The S&P 600 Small-Cap Index are full of bearish indication after past weeks' correction on credit issues.
Position: Hold
Chaitali Mohile
Active trader in the Indian stock markets since 2003 and a full-time writer. Trading is largely based upon technical analysis.
PRINT THIS ARTICLE
BULL/BEAR MARKET
Bearish Breakdown In S&P 600
08/10/07 01:58:27 PMby Chaitali Mohile
The S&P 600 Small-Cap Index are full of bearish indication after past weeks' correction on credit issues.
Position: Hold
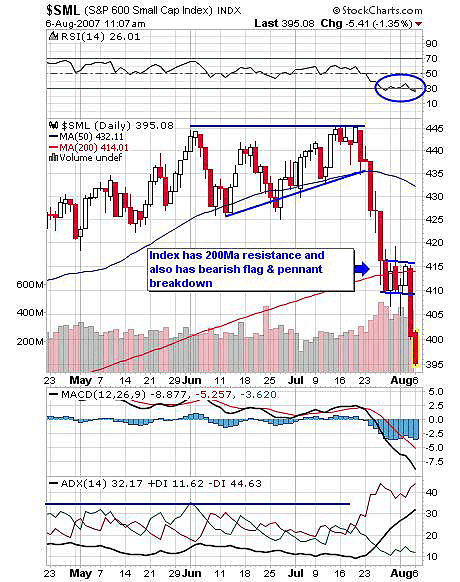
| Credit and mortgage policy in the world's strongest economy has badly affected the global equity market, and worldwide freefall can continue with these domestic problems of the US economy. Effectively, the technical charts are also filled with bearish signs, indicating more downside particularly in the S&P 600 small-cap index. The index closed 15 points down (-3.48%), breaking below the bearish flag & pennant formation. After a deep correction of around 40 points in the past days, the index under resistance & support of the 200-day moving average (200-day MA) had a volatile session in the range of 418-410, forming a bearish flag & pennant. On Friday, August 3, the index opened below the 200-day MA and traded below the lower range. This breakout signifies more downside on this index. |

|
| FIGURE 1: $SML, DAILY. The bearish flag & pennant breakout can make the index see more downside. |
| Graphic provided by: StockCharts.com. |
| |
| In Figure 1, it seems that the average directional movement index (ADX) was indicating the possibility of this correction in its movements during the past few months. According to this daily chart, the ADX (14) since mid-April 2007 supported neither of the trends. The ADX (14) remained below 20, with the positive directional index (+DI) and the negative directional index (-DI) moving closer. So logically, the index should have consolidated in a smaller range but it made a high at the 445 level. The index went through many volatile trades closer to the 445 levels. Each time the index retraced to the 50-day moving average support from the 445 level, it pulled back too. The ascending triangle was formed at the 445 level, which technically broke out in the upward direction. However, the breakout failed as credit policy news broke out in the market, adding gunpowder to the bears and the S&P 600 plunged harder from the 445 levels. Thereafter, it cracked further, winding up all bullish positions and putting bears on hold. The trend was thus captured by bears and still remains conquered. |
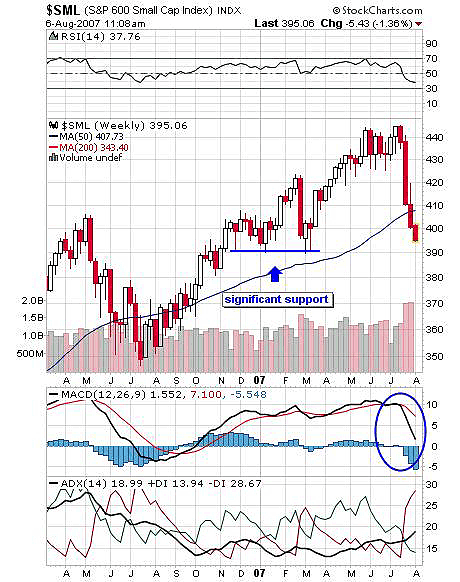
| The moving average convergence/divergence (MACD) (12,26, 9) continues to remain in a negative area with no sign of recovery in the next coming days. The relative strength index (RSI) (14) rallied down, consolidating near 30 levels. The indicator is still tipped down so the bearish strength is likely to sustain. The index thus points more to the downside on the breakdown of flag & pennants. Figure 2, the weekly chart, shows some support below 400 breakdowns, so traders who are short can hold their position and new short traders need to wait for the index to break further. This cautious trade for new sellers is recommended as the index has already corrected far from its high levels. |

|
| FIGURE 2: $SML, WEEKLY. The 390 level may offer strong support to the ongoing correction phase. |
| Graphic provided by: StockCharts.com. |
| |
| In Figure 2, the moving average support has turned to resistance. The index is now under the 50-day MA resistances and the next significant support is 390. Before the bullish rally from 390 to 425 in March 2007, the index had consolidated at this level for a considerable time. So during this ongoing correction, the 390 level should act as strong support. The MACD (12,26,9) has just turned bearish recently, but still above its zero line. The MACD histogram had moved below the zero line, giving a bearish signal. The RSI (14) also shows a bearish strength in rally. The negative directional index (-DI) shows high selling pressure and the ADX (14) below 20 indicates some consolidation at the lower levels but definitely not bullish indications. |
| Thus, the S&P 600 Small-Cap Index has more downside waiting if the 390 level is violated. I would not suggest a new short trade here till the 390 support holds. |
Active trader in the Indian stock markets since 2003 and a full-time writer. Trading is largely based upon technical analysis.
| Company: | Independent |
| Address: | C1/3 Parth Indraprasth Towers. Vastrapur |
| Ahmedabad, Guj 380015 | |
| E-mail address: | chaitalimohile@yahoo.co.in |
Traders' Resource Links | |
| Independent has not added any product or service information to TRADERS' RESOURCE. | |
Click here for more information about our publications!
PRINT THIS ARTICLE

|

Request Information From Our Sponsors
- StockCharts.com, Inc.
- Candle Patterns
- Candlestick Charting Explained
- Intermarket Technical Analysis
- John Murphy on Chart Analysis
- John Murphy's Chart Pattern Recognition
- John Murphy's Market Message
- MurphyExplainsMarketAnalysis-Intermarket Analysis
- MurphyExplainsMarketAnalysis-Visual Analysis
- StockCharts.com
- Technical Analysis of the Financial Markets
- The Visual Investor
- VectorVest, Inc.
- Executive Premier Workshop
- One-Day Options Course
- OptionsPro
- Retirement Income Workshop
- Sure-Fire Trading Systems (VectorVest, Inc.)
- Trading as a Business Workshop
- VectorVest 7 EOD
- VectorVest 7 RealTime/IntraDay
- VectorVest AutoTester
- VectorVest Educational Services
- VectorVest OnLine
- VectorVest Options Analyzer
- VectorVest ProGraphics v6.0
- VectorVest ProTrader 7
- VectorVest RealTime Derby Tool
- VectorVest Simulator
- VectorVest Variator
- VectorVest Watchdog
