HOT TOPICS LIST
- MACD
- Fibonacci
- RSI
- Gann
- ADXR
- Stochastics
- Volume
- Triangles
- Futures
- Cycles
- Volatility
- ZIGZAG
- MESA
- Retracement
- Aroon
INDICATORS LIST
LIST OF TOPICS
PRINT THIS ARTICLE
by Arthur Hill
The Russell 2000 bore the brunt of selling pressure over the last two to three weeks, but the index could be ripe for a bounce as it becomes oversold and trades at support.
Position: Accumulate
Arthur Hill
Arthur Hill is currently editor of TDTrader.com, a website specializing in trading strategies, sector/industry specific breadth stats and overall technical analysis. He passed the Society of Technical Analysts (STA London) diploma exam with distinction is a Certified Financial Technician (CFTe). Prior to TD Trader, he was the Chief Technical Analyst for Stockcharts.com and the main contributor to the ChartSchool.
PRINT THIS ARTICLE
OVERBOUGHT OVERSOLD
Russell 2000 Hits Support
08/06/07 01:52:34 PMby Arthur Hill
The Russell 2000 bore the brunt of selling pressure over the last two to three weeks, but the index could be ripe for a bounce as it becomes oversold and trades at support.
Position: Accumulate
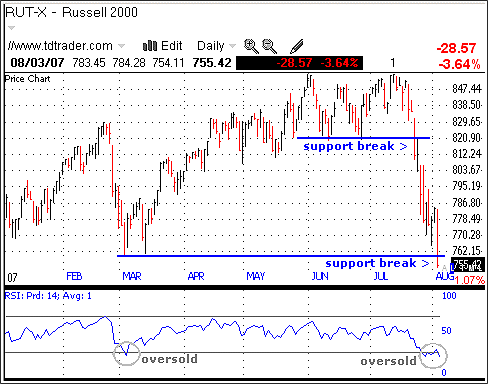
| On the daily chart (Figure 1), the Russell 2000 ($RUT) declined over 10% in the last 11 days and this is the sharpest decline since July 2002. The decline carried the index past its June lows last month and past its March lows on Friday. Technically, RUT closed below the March lows, and this support break is bearish. However, the break is just one day old and it could still be an overshoot. The Russell 2000 is made up of high-beta small-cap stocks and these are more volatile than large-caps. As such, we can expect some overshoots and I find it best to use support or resistance zones. I am setting a support zone around 760 and the index is still within 5 points of this zone. |

|
| FIGURE 1: $RUT, DAILY. The Russell 2000 declined over 10% in the last 11 days and this is the sharpest decline since July 2002. |
| Graphic provided by: TC2000.com. |
| Graphic provided by: Telechart 2007. |
| |
| In addition to a support zone around 760, the index is oversold by most measures and ripe for a bounce. First, a 10% decline in 11 days is extreme and a simple visual chart inspection shows that this decline is overdone. Second, the relative strength index (RSI) dipped below 30 for the third time this year. The first time was in March and the second in July. The index tried to bounce last week but failed and the RSI moved back below 30 on Friday. With the RSI oversold, it is too late to consider short positions and traders should be on guard for an oversold bounce. Look for the RSI to break above last week's high to start a bounce in momentum. |

|
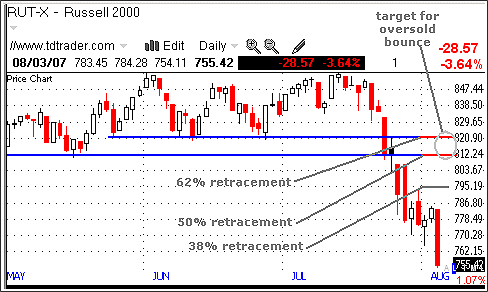
| FIGURE 2: $RUT, DAILY. How far might an oversold bounce extend? |
| Graphic provided by: Telechart 2007. |
| |
| How far might an oversold bounce extend? There are two methods to measure upside targets. First, broken support levels turn into resistance. $RUT broke the June lows at 820 and this break turns into resistance. In addition, the May lows can be incorporated as broken support at 810 and there is a broken support zone from 810 to 820. Second, countertrend rallies usually retrace 38-62% of the prior decline (~860 to ~755); 38% and 62% are based on Fibonacci numbers and 50% is based on Dow theory. This range extends from 795 to 820. I would expect a 50-62% retracement and this marks resistance around 807-820. Taken together, I would target an oversold bounce to the 805-820 region (Figure 2). |
Arthur Hill is currently editor of TDTrader.com, a website specializing in trading strategies, sector/industry specific breadth stats and overall technical analysis. He passed the Society of Technical Analysts (STA London) diploma exam with distinction is a Certified Financial Technician (CFTe). Prior to TD Trader, he was the Chief Technical Analyst for Stockcharts.com and the main contributor to the ChartSchool.
| Title: | Editor |
| Company: | TDTrader.com |
| Address: | Willem Geetsstraat 17 |
| Mechelen, B2800 | |
| Phone # for sales: | 3215345465 |
| Website: | www.tdtrader.com |
| E-mail address: | arthurh@tdtrader.com |
Traders' Resource Links | |
| TDTrader.com has not added any product or service information to TRADERS' RESOURCE. | |
Click here for more information about our publications!
PRINT THIS ARTICLE

Request Information From Our Sponsors
- StockCharts.com, Inc.
- Candle Patterns
- Candlestick Charting Explained
- Intermarket Technical Analysis
- John Murphy on Chart Analysis
- John Murphy's Chart Pattern Recognition
- John Murphy's Market Message
- MurphyExplainsMarketAnalysis-Intermarket Analysis
- MurphyExplainsMarketAnalysis-Visual Analysis
- StockCharts.com
- Technical Analysis of the Financial Markets
- The Visual Investor
- VectorVest, Inc.
- Executive Premier Workshop
- One-Day Options Course
- OptionsPro
- Retirement Income Workshop
- Sure-Fire Trading Systems (VectorVest, Inc.)
- Trading as a Business Workshop
- VectorVest 7 EOD
- VectorVest 7 RealTime/IntraDay
- VectorVest AutoTester
- VectorVest Educational Services
- VectorVest OnLine
- VectorVest Options Analyzer
- VectorVest ProGraphics v6.0
- VectorVest ProTrader 7
- VectorVest RealTime Derby Tool
- VectorVest Simulator
- VectorVest Variator
- VectorVest Watchdog
