HOT TOPICS LIST
- MACD
- Fibonacci
- RSI
- Gann
- ADXR
- Stochastics
- Volume
- Triangles
- Futures
- Cycles
- Volatility
- ZIGZAG
- MESA
- Retracement
- Aroon
INDICATORS LIST
LIST OF TOPICS
PRINT THIS ARTICLE
by David Penn
Intraday divergences and candlestick reversal patterns hint at a higher S&P in the early days of August.
Position: N/A
David Penn
Technical Writer for Technical Analysis of STOCKS & COMMODITIES magazine, Working-Money.com, and Traders.com Advantage.
PRINT THIS ARTICLE
REVERSAL
Upside Opportunities In The S&P 500
08/06/07 02:02:25 PMby David Penn
Intraday divergences and candlestick reversal patterns hint at a higher S&P in the early days of August.
Position: N/A
| While it is true that not every bottom is heralded with colorful reversal patterns and glimmering divergences, it is no less true that any trader or market technician searching for a bottom in the market would do well to look for just these sorts of clues when deciding whether the end is in fact near. |
| With the market meltdown of the past week still fresh in the minds of most traders and technicians, we are beginning to see what we need to see before looking for some upside in this market, to say nothing of actually taking a bet on higher prices materializing before lower prices. |

|
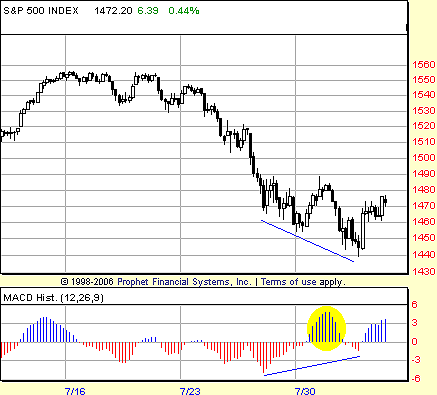
| FIGURE 1: STANDARD & POOR’S 500, HOURLY. Positive divergences in the MACD histogram reveal waning downside momentum, and an opportunity for buyers to take control and bid the market higher. |
| Graphic provided by: Prophet Financial, Inc. |
| |
| The daily chart, in which the Standard & Poor's 500 remains below the 50-day exponential moving average (EMA), is not nearly the treasure trove of potential reversal patterns that we find in the hourly chart. As Figure 1 shows, we have a sizable positive divergence between the moving average convergence/divergence histogram (MACDH) and prices as the latter goes on to make lower lows while the former is doing the exact opposite. |

|
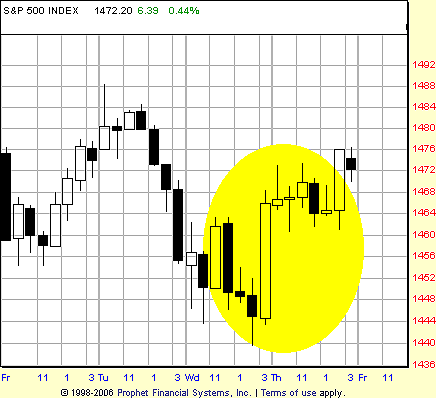
| FIGURE 2: STANDARD & POOR’S 500, HOURLY. This bullish engulfing pattern in the final hour of trading on Wednesday coincided perfectly with a positive divergence in the MACD histogram. |
| Graphic provided by: Prophet Financial, Inc. |
| |
| We also have one of my favorite signals of an impending reversal in the extreme MACDH peak that formed just as the markets were making what appears to be their final bounce before the bottom. MACDH extreme peaks such as this often hint at a market that is ready to rally in the direction of the peak. These peaks need to be unique and, indeed, extreme. They should clearly stand out compared to all other peaks in recent history, as does the one in Figure 1. Typically, as a rule of thumb, I say that the price highs that accompany such extreme MACDH peaks will be exceeded, at a minimum. This means that the S&P 500 is likely to reach 1490 in its next move higher. |
| And that move higher should be sooner rather than later. In Figure 2 we see a key reversal pattern, one that accompanied the positive divergence in the MACDH. This reversal pattern was a bullish engulfing pattern — an engulfing pattern that was in this instance so powerful to have engulfed the real body of not just the preceding candlestick line, but also of the five other candlestick lines that preceded that one. Alone, this would be a reversal signal worth noting. In concert with the positive divergence in the MACDH, this bullish engulfing is a strong warning to those still looking to sell the S&P 500 short. |
Technical Writer for Technical Analysis of STOCKS & COMMODITIES magazine, Working-Money.com, and Traders.com Advantage.
| Title: | Technical Writer |
| Company: | Technical Analysis, Inc. |
| Address: | 4757 California Avenue SW |
| Seattle, WA 98116 | |
| Phone # for sales: | 206 938 0570 |
| Fax: | 206 938 1307 |
| Website: | www.Traders.com |
| E-mail address: | DPenn@traders.com |
Traders' Resource Links | |
| Charting the Stock Market: The Wyckoff Method -- Books | |
| Working-Money.com -- Online Trading Services | |
| Traders.com Advantage -- Online Trading Services | |
| Technical Analysis of Stocks & Commodities -- Publications and Newsletters | |
| Working Money, at Working-Money.com -- Publications and Newsletters | |
| Traders.com Advantage -- Publications and Newsletters | |
| Professional Traders Starter Kit -- Software | |
Click here for more information about our publications!
PRINT THIS ARTICLE

Request Information From Our Sponsors
- VectorVest, Inc.
- Executive Premier Workshop
- One-Day Options Course
- OptionsPro
- Retirement Income Workshop
- Sure-Fire Trading Systems (VectorVest, Inc.)
- Trading as a Business Workshop
- VectorVest 7 EOD
- VectorVest 7 RealTime/IntraDay
- VectorVest AutoTester
- VectorVest Educational Services
- VectorVest OnLine
- VectorVest Options Analyzer
- VectorVest ProGraphics v6.0
- VectorVest ProTrader 7
- VectorVest RealTime Derby Tool
- VectorVest Simulator
- VectorVest Variator
- VectorVest Watchdog
- StockCharts.com, Inc.
- Candle Patterns
- Candlestick Charting Explained
- Intermarket Technical Analysis
- John Murphy on Chart Analysis
- John Murphy's Chart Pattern Recognition
- John Murphy's Market Message
- MurphyExplainsMarketAnalysis-Intermarket Analysis
- MurphyExplainsMarketAnalysis-Visual Analysis
- StockCharts.com
- Technical Analysis of the Financial Markets
- The Visual Investor
