HOT TOPICS LIST
- MACD
- Fibonacci
- RSI
- Gann
- ADXR
- Stochastics
- Volume
- Triangles
- Futures
- Cycles
- Volatility
- ZIGZAG
- MESA
- Retracement
- Aroon
INDICATORS LIST
LIST OF TOPICS
PRINT THIS ARTICLE
by David Penn
Positive divergences in the second half of July helped create a bottom in the falling DJUA.
Position: N/A
David Penn
Technical Writer for Technical Analysis of STOCKS & COMMODITIES magazine, Working-Money.com, and Traders.com Advantage.
PRINT THIS ARTICLE
REVERSAL
Divergences And The Dow Jones Utilities Index
08/06/07 11:05:25 AMby David Penn
Positive divergences in the second half of July helped create a bottom in the falling DJUA.
Position: N/A
| The Dow Jones Utilities Average (DJUA) topped in the spring of 2007 near 535. From that high in mid-May, the DJUA fell to about 485 by the second half of June before bouncing to a high just north of 520 by mid-July. |
| Since then, the DJUA has slipped back into correction mode, creating a new low for the decline as it failed to take out the May high and, instead, took out the June lows in ferocious fashion in the second half of July (Figure 1). |

|
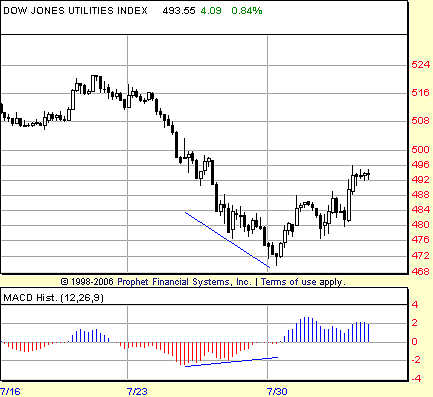
| FIGURE 1: DOW JONES UTILITIES INDEX, HOURLY. Divergences early in the second half of July helped traders anticipate this bottom in the utilities average. Note also the morning star pattern that appears at precisely the moment when the market reverses. |
| Graphic provided by: Quote.com. |
| |
| The utilities have been in rally mode ever since, moving higher in a nearly vertical advance that as of this writing has retraced just short of 50% of the late July decline. The bottom that made the rally possible was telegraphed fairly clearly by the moving average convergence/divergence histogram (MACDH). But you had to be looking at the hourly charts in order to spot it. See Figure 2. |

|
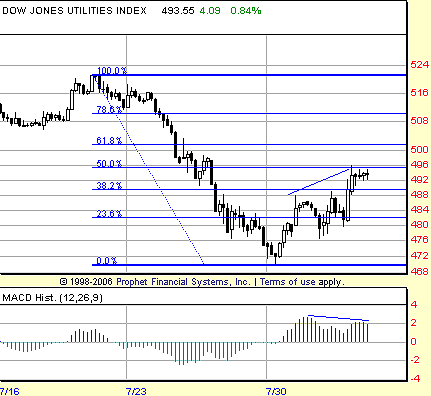
| FIGURE 2: DOW JONES UTILITIES INDEX, HOURLY. As the utilities average climbs toward a 50% retracement of its late July correction, negative divergences begin to appear in the MACD histogram. While the DJUA is likely to continue moving higher in the near term, momentum to the upside is clearly growing weaker. |
| Graphic provided by: Prophet Financial, Inc. |
| |
| The MACDH began making a series of higher lows in the hourly charts on July 26 and did so again on July 30 while the DJUA was continuing to move lower. The hourly charts also reveal the key moment when momentum to the downside ran out for the bears and gave bulls an opening to push prices back up. That moment was a morning star candlestick pattern on July 30, which coincided perfectly with the second higher low in the MACDH and a clear positive divergence. Confirmation of the morning star pattern came immediately with an hourly close above the high of the pattern. |
| Since reversing, the DJUA has retraced nearly 50% of its decline from the highs of mid-July. In doing so, the index has begun creating new divergences at the hourly level. These divergences, in contrast to the earlier ones, are negative or bearish divergences. Note how as the DJUA advances, the peaks in the MACDH grow smaller. While this is often the case in newly advancing markets, the shrinking MACDH is a warning to traders that momentum to the upside is waning and that the chances of a correction to this bounce are increasing. |
Technical Writer for Technical Analysis of STOCKS & COMMODITIES magazine, Working-Money.com, and Traders.com Advantage.
| Title: | Technical Writer |
| Company: | Technical Analysis, Inc. |
| Address: | 4757 California Avenue SW |
| Seattle, WA 98116 | |
| Phone # for sales: | 206 938 0570 |
| Fax: | 206 938 1307 |
| Website: | www.Traders.com |
| E-mail address: | DPenn@traders.com |
Traders' Resource Links | |
| Charting the Stock Market: The Wyckoff Method -- Books | |
| Working-Money.com -- Online Trading Services | |
| Traders.com Advantage -- Online Trading Services | |
| Technical Analysis of Stocks & Commodities -- Publications and Newsletters | |
| Working Money, at Working-Money.com -- Publications and Newsletters | |
| Traders.com Advantage -- Publications and Newsletters | |
| Professional Traders Starter Kit -- Software | |
Click here for more information about our publications!
PRINT THIS ARTICLE

Request Information From Our Sponsors
- StockCharts.com, Inc.
- Candle Patterns
- Candlestick Charting Explained
- Intermarket Technical Analysis
- John Murphy on Chart Analysis
- John Murphy's Chart Pattern Recognition
- John Murphy's Market Message
- MurphyExplainsMarketAnalysis-Intermarket Analysis
- MurphyExplainsMarketAnalysis-Visual Analysis
- StockCharts.com
- Technical Analysis of the Financial Markets
- The Visual Investor
- VectorVest, Inc.
- Executive Premier Workshop
- One-Day Options Course
- OptionsPro
- Retirement Income Workshop
- Sure-Fire Trading Systems (VectorVest, Inc.)
- Trading as a Business Workshop
- VectorVest 7 EOD
- VectorVest 7 RealTime/IntraDay
- VectorVest AutoTester
- VectorVest Educational Services
- VectorVest OnLine
- VectorVest Options Analyzer
- VectorVest ProGraphics v6.0
- VectorVest ProTrader 7
- VectorVest RealTime Derby Tool
- VectorVest Simulator
- VectorVest Variator
- VectorVest Watchdog
