

HOT TOPICS LIST
- MACD
- Fibonacci
- RSI
- Gann
- ADXR
- Stochastics
- Volume
- Triangles
- Futures
- Cycles
- Volatility
- ZIGZAG
- MESA
- Retracement
- Aroon
INDICATORS LIST
LIST OF TOPICS
PRINT THIS ARTICLE
by Gary Grosschadl
The Dow Jones Industrial Average has declined some 800 points from its 14,000 high. What is the next likely move?
Position: Hold
Gary Grosschadl
Independent Canadian equities trader and technical analyst based in Peterborough
Ontario, Canada.
PRINT THIS ARTICLE
ANDREWS PITCH-FORK
The Dow Jones Pitchfork View
08/03/07 09:22:33 AMby Gary Grosschadl
The Dow Jones Industrial Average has declined some 800 points from its 14,000 high. What is the next likely move?
Position: Hold
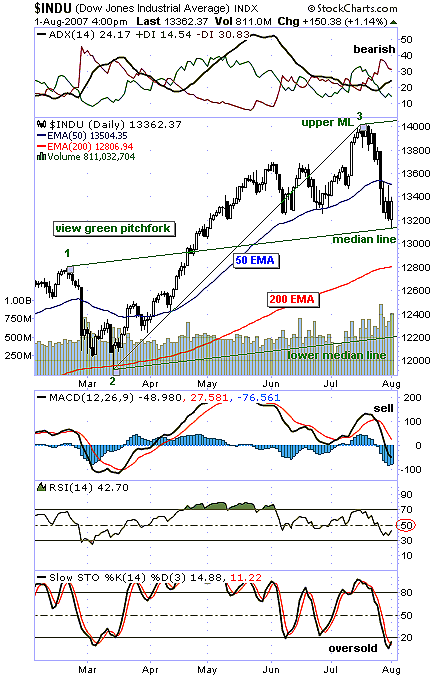
| The daily chart of this most-watched index shows a magnificent run from the low on this chart of 12,000 to a giddy 14,000 high (Figure 1). One less common way of showing possible support and resistance comes from the Andrews line method, also known as the Andrews pitchfork tool. With this method, three turning points are chosen (in this case, turning points 1, 2, 3) and then the chart software automatically plots the median lines representing likely support and resistance levels. One of the "rules" of pitchfork theory maintains that a move off either the upper median line or the lower median line eventually reaches the center median line. Here we have the perfect example. Remember that this can be plotted in advance — after the turn starts at 14000. Here we see a perfect bounce attempt at this median line. |
| What are the possibilities going forward from here? Let's ignore the moving average lines for the moment and just consider the pitchfork itself. If this median line holds, then a bullish bias persists as this pitchfork points up. The continued rise will tend to stay between the median line and the upper median line until one of those lines is violated. Should a future test of this center median line fail, then there will be a pull toward the lower median line. The bigger picture says the uptrend is intact as long as the lower median line is not violated. Traders, being traders, will often play the anticipated moves between the three median lines. |
|
| FIGURE 1: INDU, DAILY. This Andrews pitchfork shows a perfect bounce (so far) at the median line. |
| Graphic provided by: StockCharts.com. |
| |
| Now let's factor in those moving average lines. The 50-day exponential moving average (EMA), the more sensitive sister of the simple moving average, held support during the major part of this rise. With it now being violated to the downside, it should be considered important overhead resistance. If this bounce off the median line is to be sustainable vs. short-lived, then the index must close above the 50-day EMA. Failure at this EMA would result in another median line test but in my mind most likely would bring about a test of the ever-important 200-day EMA currently at 12,800. Under bearish-enough conditions, should the 200-day EMA give way, then the lower median line near 12,200 could be a trading target. |
| Several indicators are considered. At the top of the chart, the directional movement indicator shows a bearish stance with a rising average directional index (ADX) between bearishly poised DIs (directional movement indicators). Below the chart, the moving average convergence/divergence (MACD) shows a sell signal occurring several trading days ago. The relative strength index (RSI) shows a decline from the 70 level, which fell below the 50 level. Watch this 50 level as a possible key resistance going forward. Finally, the stochastic oscillator reminds traders that this is an oversold condition with a bounce attempt likely under way. |
| In summary, a bounce attempt is being made with the immediate upside test being the 50-day EMA. Failure there could bring a swing down to test the 200-day EMA. Should that occur, keep an eye on those median lines for further guidance of support and resistance. |
Independent Canadian equities trader and technical analyst based in Peterborough
Ontario, Canada.
| Website: | www.whatsonsale.ca/financial.html |
| E-mail address: | gwg7@sympatico.ca |
Click here for more information about our publications!
Comments

Request Information From Our Sponsors
- StockCharts.com, Inc.
- Candle Patterns
- Candlestick Charting Explained
- Intermarket Technical Analysis
- John Murphy on Chart Analysis
- John Murphy's Chart Pattern Recognition
- John Murphy's Market Message
- MurphyExplainsMarketAnalysis-Intermarket Analysis
- MurphyExplainsMarketAnalysis-Visual Analysis
- StockCharts.com
- Technical Analysis of the Financial Markets
- The Visual Investor
- VectorVest, Inc.
- Executive Premier Workshop
- One-Day Options Course
- OptionsPro
- Retirement Income Workshop
- Sure-Fire Trading Systems (VectorVest, Inc.)
- Trading as a Business Workshop
- VectorVest 7 EOD
- VectorVest 7 RealTime/IntraDay
- VectorVest AutoTester
- VectorVest Educational Services
- VectorVest OnLine
- VectorVest Options Analyzer
- VectorVest ProGraphics v6.0
- VectorVest ProTrader 7
- VectorVest RealTime Derby Tool
- VectorVest Simulator
- VectorVest Variator
- VectorVest Watchdog