

HOT TOPICS LIST
- MACD
- Fibonacci
- RSI
- Gann
- ADXR
- Stochastics
- Volume
- Triangles
- Futures
- Cycles
- Volatility
- ZIGZAG
- MESA
- Retracement
- Aroon
INDICATORS LIST
LIST OF TOPICS
PRINT THIS ARTICLE
by Arthur Hill
Ryder Systems bounced off support with big volume, and a resistance breakout looks imminent.
Position: Accumulate
Arthur Hill
Arthur Hill is currently editor of TDTrader.com, a website specializing in trading strategies, sector/industry specific breadth stats and overall technical analysis. He passed the Society of Technical Analysts (STA London) diploma exam with distinction is a Certified Financial Technician (CFTe). Prior to TD Trader, he was the Chief Technical Analyst for Stockcharts.com and the main contributor to the ChartSchool.
PRINT THIS ARTICLE
ON BALANCE VOLUME
Ryder Fuels Up On Big Volume
08/03/07 11:00:14 AMby Arthur Hill
Ryder Systems bounced off support with big volume, and a resistance breakout looks imminent.
Position: Accumulate
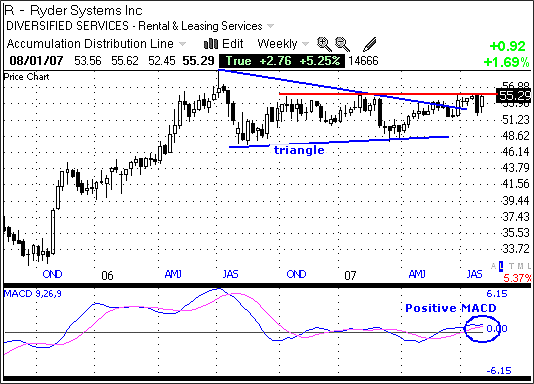
| On the weekly chart, Ryder Systems (R) surged from the mid-30s to the mid-50s and then began a long consolidation (Figure 1). The stock traded flat from July 2006 until July 2007 and formed a large triangle. With the advance over the last few months, the stock broke the upper triangle trendline and is challenging resistance around 55-56. A breakout here would be most bullish and signal a continuation of the previous advance. Before leaving this chart, I would also like to point out that the moving average convergence/divergence (MACD) moved above its signal line and into positive territory over the last few months, and momentum favors the bulls. |
|
| FIGURE 1: RYDER SYSTEM, WEEKLY. R surged from the mid-30s to the mid-50s and then began a long consolidation. |
| Graphic provided by: Telechart 2007. |
| |
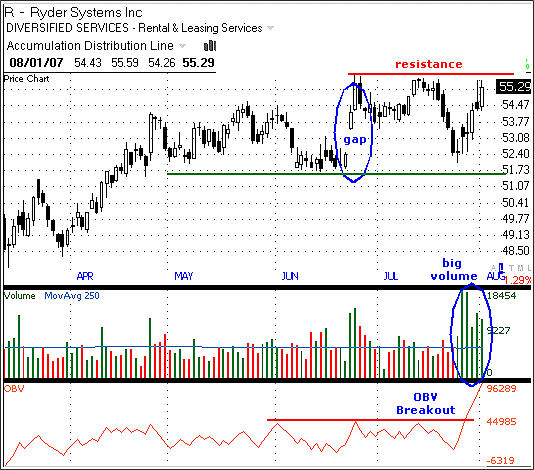
| Turning to the daily chart, we can see a massive surge in volume, and a strong bounce off support over the last six days (Figure 2). The stock first bounced off support in late June and met resistance at 56. There was a sharp pullback to the low 50s and the stock held support. The surge off support with big volume is most impressive, and this increases the chances of a breakout at 56. Volume is fuel, and this move appears to have plenty of fuel. |
|
| FIGURE 2: RYDER SYSTEM, DAILY. There was a sharp surge in volume and a strong bounce off support. |
| Graphic provided by: Telechart 2007. |
| |
| A breakout in on-balance volume (OBV) confirms strong volume flows. OBV was popularized by technician Joe Granville, and this indicator measures money flow. Volume is added on up days and subtracted on down days to form a cumulative measure of money flow. The idea is that volume leads price and a breakout in OBV should be followed by a breakout in the stock. Well, OBV broke resistance with a big move over the last few days, and this affirms strong buying pressure in the stock. Now I am waiting for price to follow volume with a breakout. |
Arthur Hill is currently editor of TDTrader.com, a website specializing in trading strategies, sector/industry specific breadth stats and overall technical analysis. He passed the Society of Technical Analysts (STA London) diploma exam with distinction is a Certified Financial Technician (CFTe). Prior to TD Trader, he was the Chief Technical Analyst for Stockcharts.com and the main contributor to the ChartSchool.
| Title: | Editor |
| Company: | TDTrader.com |
| Address: | Willem Geetsstraat 17 |
| Mechelen, B2800 | |
| Phone # for sales: | 3215345465 |
| Website: | www.tdtrader.com |
| E-mail address: | arthurh@tdtrader.com |
Traders' Resource Links | |
| TDTrader.com has not added any product or service information to TRADERS' RESOURCE. | |
Click here for more information about our publications!
Comments

Request Information From Our Sponsors
- StockCharts.com, Inc.
- Candle Patterns
- Candlestick Charting Explained
- Intermarket Technical Analysis
- John Murphy on Chart Analysis
- John Murphy's Chart Pattern Recognition
- John Murphy's Market Message
- MurphyExplainsMarketAnalysis-Intermarket Analysis
- MurphyExplainsMarketAnalysis-Visual Analysis
- StockCharts.com
- Technical Analysis of the Financial Markets
- The Visual Investor
- VectorVest, Inc.
- Executive Premier Workshop
- One-Day Options Course
- OptionsPro
- Retirement Income Workshop
- Sure-Fire Trading Systems (VectorVest, Inc.)
- Trading as a Business Workshop
- VectorVest 7 EOD
- VectorVest 7 RealTime/IntraDay
- VectorVest AutoTester
- VectorVest Educational Services
- VectorVest OnLine
- VectorVest Options Analyzer
- VectorVest ProGraphics v6.0
- VectorVest ProTrader 7
- VectorVest RealTime Derby Tool
- VectorVest Simulator
- VectorVest Variator
- VectorVest Watchdog