HOT TOPICS LIST
- MACD
- Fibonacci
- RSI
- Gann
- ADXR
- Stochastics
- Volume
- Triangles
- Futures
- Cycles
- Volatility
- ZIGZAG
- MESA
- Retracement
- Aroon
INDICATORS LIST
LIST OF TOPICS
PRINT THIS ARTICLE
by David Penn
A pair of bullish belt hold patterns in the greenback suggest near-term strength.
Position: N/A
David Penn
Technical Writer for Technical Analysis of STOCKS & COMMODITIES magazine, Working-Money.com, and Traders.com Advantage.
PRINT THIS ARTICLE
CANDLESTICK CHARTING
Belt Holds Bolster The Dollar
08/02/07 09:00:29 AMby David Penn
A pair of bullish belt hold patterns in the greenback suggest near-term strength.
Position: N/A
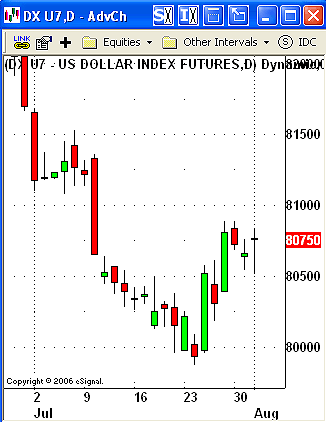
| When I first saw the reversal pattern developing in the September US dollar, I wanted desperately for the pattern to be a morning star. But the first leg of a morning star pattern needs to be a down candlestick line. The market needs to fall into a morning star, with a bearish session leading to a gap down neutral session, which is then followed by a clearly bullish session. Unfortunately for me, the initial candlestick line of the would-be morning star was bullish, rather than bearish, as the market gapped down but finished significantly higher during that session. |
| So even though the rest of the pattern, the other two-thirds, very much resembled a morning star reversal pattern, I was forced to look elsewhere for the proper descriptor of this obviously significant — and potentially significantly bullish — development. Fortunately, there aren't too many candlestick patterns that have escaped the analysis of Steve Nison, author of Japanese Candlestick Charting Techniques and Beyond Candlesticks. On closer observation, and a few minutes of consultation with Nison's first book, I realized that the bottoming pattern in the September dollar actually consisted of a number of patterns. And two of those patterns were the less-often-discussed bullish belt hold. (See Figure 1.) |

|
| FIGURE 1: US DOLLAR INDEX, SEPTEMBER FUTURES, DAILY. Three bullish belt hold patterns appear in the second half of June, stemming the dollarís descent and signaling higher prices in the near term. |
| Graphic provided by: eSignal. |
| |
| The bullish belt hold pattern occurs when a market opens at or very near the lows and finishes near the highs of the session. In addition, bullish belt hold patterns are long lines and reflect an impressive range as buyers bid prices higher over the course of the session. As is the case with all Japanese candlestick patterns, context is critical. A bullish belt hold pattern appears as a reversal pattern only when it has something to reverse, such as a mature downtrend or a short-term correction in an overall uptrend. |
| Here, the bullish belt holds develop at the end of a mature downtrend in the September greenback. The first one is what I had wished would be the initial leg of the morning star. The second, a larger, arguably more convincing bullish belt hold appears two days later and a third, two days later still. Trading rules allow for positions as soon as there is a confirming close. By a confirming close — and, moreover, a bullish confirming close in this case — I mean a close that is above the high of the highest point in the pattern. In the case of a bullish belt hold, that would mean a close above the high point of that single candlestick line. |
Technical Writer for Technical Analysis of STOCKS & COMMODITIES magazine, Working-Money.com, and Traders.com Advantage.
| Title: | Technical Writer |
| Company: | Technical Analysis, Inc. |
| Address: | 4757 California Avenue SW |
| Seattle, WA 98116 | |
| Phone # for sales: | 206 938 0570 |
| Fax: | 206 938 1307 |
| Website: | www.Traders.com |
| E-mail address: | DPenn@traders.com |
Traders' Resource Links | |
| Charting the Stock Market: The Wyckoff Method -- Books | |
| Working-Money.com -- Online Trading Services | |
| Traders.com Advantage -- Online Trading Services | |
| Technical Analysis of Stocks & Commodities -- Publications and Newsletters | |
| Working Money, at Working-Money.com -- Publications and Newsletters | |
| Traders.com Advantage -- Publications and Newsletters | |
| Professional Traders Starter Kit -- Software | |
Click here for more information about our publications!
PRINT THIS ARTICLE

Request Information From Our Sponsors
- StockCharts.com, Inc.
- Candle Patterns
- Candlestick Charting Explained
- Intermarket Technical Analysis
- John Murphy on Chart Analysis
- John Murphy's Chart Pattern Recognition
- John Murphy's Market Message
- MurphyExplainsMarketAnalysis-Intermarket Analysis
- MurphyExplainsMarketAnalysis-Visual Analysis
- StockCharts.com
- Technical Analysis of the Financial Markets
- The Visual Investor
- VectorVest, Inc.
- Executive Premier Workshop
- One-Day Options Course
- OptionsPro
- Retirement Income Workshop
- Sure-Fire Trading Systems (VectorVest, Inc.)
- Trading as a Business Workshop
- VectorVest 7 EOD
- VectorVest 7 RealTime/IntraDay
- VectorVest AutoTester
- VectorVest Educational Services
- VectorVest OnLine
- VectorVest Options Analyzer
- VectorVest ProGraphics v6.0
- VectorVest ProTrader 7
- VectorVest RealTime Derby Tool
- VectorVest Simulator
- VectorVest Variator
- VectorVest Watchdog
