HOT TOPICS LIST
- MACD
- Fibonacci
- RSI
- Gann
- ADXR
- Stochastics
- Volume
- Triangles
- Futures
- Cycles
- Volatility
- ZIGZAG
- MESA
- Retracement
- Aroon
INDICATORS LIST
LIST OF TOPICS
PRINT THIS ARTICLE
by Chaitali Mohile
With stronger support & resistance at different levels, is it wise to expect wide range moves in the DJIA?
Position: N/A
Chaitali Mohile
Active trader in the Indian stock markets since 2003 and a full-time writer. Trading is largely based upon technical analysis.
PRINT THIS ARTICLE
SUPPORT & RESISTANCE
Dow Jones Industrial Average At Crossroads
08/10/07 12:57:07 PMby Chaitali Mohile
With stronger support & resistance at different levels, is it wise to expect wide range moves in the DJIA?
Position: N/A
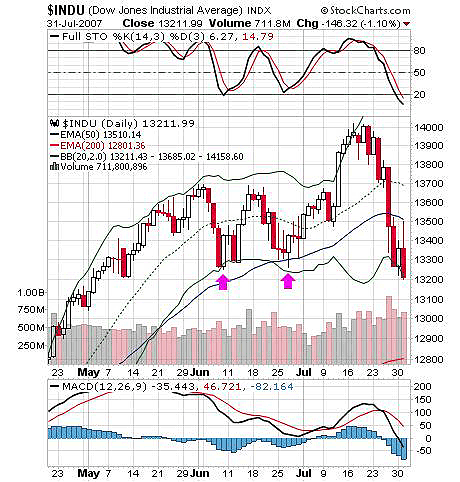
| Unstable market conditions make trading tough. Credit problems in the US has left serious marks on markets all over the world. Under such scenarios, dealing with any index or stock from a support & resistance range also becomes tricky. The Dow Jones Industrial Average's (DJIA) daily chart shows various support & resistance areas, but is it really worth trading those levels (Figure 1)? The 13300 level is the first low pivot support level and $INDU is trading below this level with respect to the July 31st close. On the same support level I expected a rally for the correction witnessed days before, but I was wrong. More than support, the average has a strong resistance at the 50-day exponential moving average (EMA) at 13510. On that one bullish day on July 30, this range was traded with the expectation of a pullback. |

|
| FIGURE 1: DJIA, DAILY. This chart shows various support & resistance areas. |
| Graphic provided by: StockCharts.com. |
| |
| The Bollinger Band shows the increased gaps between the upper and lower bands. The upper Bollinger Band had advanced steeply with a four-day bullish rally in early July 2007. The gap between two bands widens with this bullish rally, but the correction of just three to four days made the price retrace towards the lower band support. Previously, the DJIA had bounced off the lower band (marked arrows), and accordingly the bullish move can be expected with the same support. The 50-day EMA will remain as a strong resistance for any bullish rallies that will follow. |
| The stochastic (14,3,3) has moved below 20, indicating that very little downside remains. But traders need to wait till the stochastic actually turns up. The moving average convergence/divergence (MACD) is below the trigger line. So both the indicators are still negative to support the bullish rally. Traders can follow price action along the support line. |

|
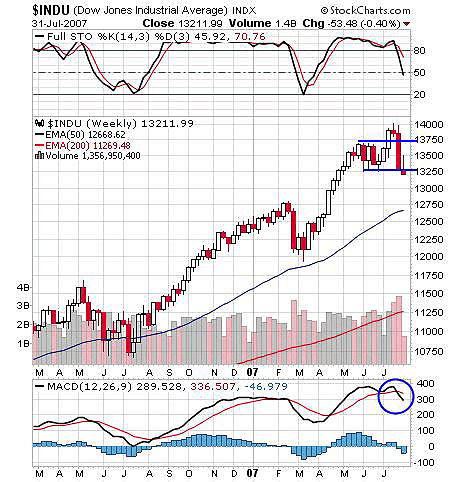
| FIGURE 2: DJIA, WEEKLY. The previous week correction established support at the lower range of the continuation pattern. |
| Graphic provided by: StockCharts.com. |
| |
| In Figure 2, the previous week correction established support at the lower range of continuation pattern. The breakout of flag & pennant failed as the DJIA corrected immediately from 14000 levels. In late July the index closed marginally below support, so this level has high importance. Stochastic (14, 3,3) is below 50, so it is definitely not a trading level unless the price shows some hint of a directional move. The MACD (12,26,9) has a bearish crossover. So on a weekly basis things are looking bearish. |
Active trader in the Indian stock markets since 2003 and a full-time writer. Trading is largely based upon technical analysis.
| Company: | Independent |
| Address: | C1/3 Parth Indraprasth Towers. Vastrapur |
| Ahmedabad, Guj 380015 | |
| E-mail address: | chaitalimohile@yahoo.co.in |
Traders' Resource Links | |
| Independent has not added any product or service information to TRADERS' RESOURCE. | |
Click here for more information about our publications!
PRINT THIS ARTICLE

Request Information From Our Sponsors
- StockCharts.com, Inc.
- Candle Patterns
- Candlestick Charting Explained
- Intermarket Technical Analysis
- John Murphy on Chart Analysis
- John Murphy's Chart Pattern Recognition
- John Murphy's Market Message
- MurphyExplainsMarketAnalysis-Intermarket Analysis
- MurphyExplainsMarketAnalysis-Visual Analysis
- StockCharts.com
- Technical Analysis of the Financial Markets
- The Visual Investor
- VectorVest, Inc.
- Executive Premier Workshop
- One-Day Options Course
- OptionsPro
- Retirement Income Workshop
- Sure-Fire Trading Systems (VectorVest, Inc.)
- Trading as a Business Workshop
- VectorVest 7 EOD
- VectorVest 7 RealTime/IntraDay
- VectorVest AutoTester
- VectorVest Educational Services
- VectorVest OnLine
- VectorVest Options Analyzer
- VectorVest ProGraphics v6.0
- VectorVest ProTrader 7
- VectorVest RealTime Derby Tool
- VectorVest Simulator
- VectorVest Variator
- VectorVest Watchdog
