HOT TOPICS LIST
- MACD
- Fibonacci
- RSI
- Gann
- ADXR
- Stochastics
- Volume
- Triangles
- Futures
- Cycles
- Volatility
- ZIGZAG
- MESA
- Retracement
- Aroon
INDICATORS LIST
LIST OF TOPICS
PRINT THIS ARTICLE
by Gary Grosschadl
This Chicago-based clothing company founded in 1872 has a bullish chart and appears headed higher.
Position: N/A
Gary Grosschadl
Independent Canadian equities trader and technical analyst based in Peterborough
Ontario, Canada.
PRINT THIS ARTICLE
CHART ANALYSIS
Hartmarx Corp. Bucking The Trend
08/02/07 08:32:46 AMby Gary Grosschadl
This Chicago-based clothing company founded in 1872 has a bullish chart and appears headed higher.
Position: N/A
| Not very many stocks are bucking the overall short-term downtrend that is challenging the overall markets right now. Hartmarx (HMX) is one that looks promising. |
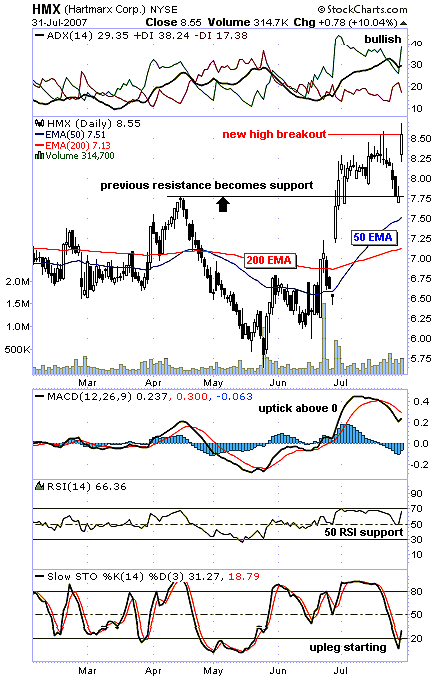
| Figure 1 shows a big jump in price early in July as its quarterly report showed a 39% increase. After topping out near $8.50, it corrected to a level of previous resistance near 7.75. What caused this one-day gap higher is unclear. Perhaps an aggressive fund manager loading up based on healthy guidance forward? Maybe even some irrational exuberance. Either way, the chart hints at possible continued momentum. |

|
| FIGURE 1: HMX, DAILY. A gap and a strong close shows bullish promise. |
| Graphic provided by: StockCharts.com. |
| |
| Note the earlier moving average crossover. The 50-day exponential moving average (EMA) crossing above the 200-day EMA no doubt triggered bullish attention. This is often a popular scan for buyers looking for bullish-turning stocks. |
| Several bullish indicators are worth noting. The directional movement indicator at the top of the chart shows a very bullish stance with the average directional movement indicator (ADX) above 29 and between properly poised DIs (directional indicators). This configuration shows a strong trend in place. The moving average convergence/divergence (MACD) is still above zero and is upticking, hinting at a possible future crossing of its red signal line. Meanwhile, the relative strength index (RSI) is showing a bounce of its 50 level. This often serves as a key area of support or resistance. The stochastic oscillator shows an upswing from oversold levels, hinting at a stochastic upleg beginning. |
| The volume signal could be bigger, but there is some fear regarding the overall markets right now, and this could dampen buying volume. With some bullish follow-through, the upside target for aggressive traders would be the high of 2006, which was $10, close to the multiyear high of 10.50. |
Independent Canadian equities trader and technical analyst based in Peterborough
Ontario, Canada.
| Website: | www.whatsonsale.ca/financial.html |
| E-mail address: | gwg7@sympatico.ca |
Click here for more information about our publications!
PRINT THIS ARTICLE

Request Information From Our Sponsors
- StockCharts.com, Inc.
- Candle Patterns
- Candlestick Charting Explained
- Intermarket Technical Analysis
- John Murphy on Chart Analysis
- John Murphy's Chart Pattern Recognition
- John Murphy's Market Message
- MurphyExplainsMarketAnalysis-Intermarket Analysis
- MurphyExplainsMarketAnalysis-Visual Analysis
- StockCharts.com
- Technical Analysis of the Financial Markets
- The Visual Investor
- VectorVest, Inc.
- Executive Premier Workshop
- One-Day Options Course
- OptionsPro
- Retirement Income Workshop
- Sure-Fire Trading Systems (VectorVest, Inc.)
- Trading as a Business Workshop
- VectorVest 7 EOD
- VectorVest 7 RealTime/IntraDay
- VectorVest AutoTester
- VectorVest Educational Services
- VectorVest OnLine
- VectorVest Options Analyzer
- VectorVest ProGraphics v6.0
- VectorVest ProTrader 7
- VectorVest RealTime Derby Tool
- VectorVest Simulator
- VectorVest Variator
- VectorVest Watchdog
