HOT TOPICS LIST
- MACD
- Fibonacci
- RSI
- Gann
- ADXR
- Stochastics
- Volume
- Triangles
- Futures
- Cycles
- Volatility
- ZIGZAG
- MESA
- Retracement
- Aroon
INDICATORS LIST
LIST OF TOPICS
PRINT THIS ARTICLE
by Arthur Hill
After meeting stiff resistance from its March high, the Nikkei gapped down and broke support to reverse a 12-month uptrend. At the very least, we can expect a retracement of this big rally.
Position: Sell
Arthur Hill
Arthur Hill is currently editor of TDTrader.com, a website specializing in trading strategies, sector/industry specific breadth stats and overall technical analysis. He passed the Society of Technical Analysts (STA London) diploma exam with distinction is a Certified Financial Technician (CFTe). Prior to TD Trader, he was the Chief Technical Analyst for Stockcharts.com and the main contributor to the ChartSchool.
PRINT THIS ARTICLE
REL. STR OSCILL
A Breakdown In The Nikkei
07/31/07 08:48:56 AMby Arthur Hill
After meeting stiff resistance from its March high, the Nikkei gapped down and broke support to reverse a 12-month uptrend. At the very least, we can expect a retracement of this big rally.
Position: Sell
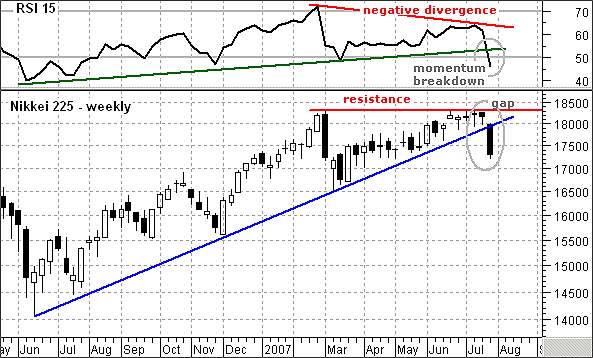
| On the weekly chart (Figure 1), the Nikkei 225 ($N225) met resistance from its March high and gapped down last week. The index first closed above 18000 in mid-June and then stalled with five small candlesticks. These five small candlesticks showed indecision, and the index indicated its mind was made up, coming up with a long black candlestick. The decline featured a gap and broke the trendline extending up from June 2006. This gap should be considered bearish as long as it remains unfilled and the trendline break signals a reversal in momentum. Look for a move above the July highs to reverse this signal. |

|
| FIGURE 1: NIKKEI 225, WEEKLY. The Nikkei met resistance from its March high and gapped down recently. |
| Graphic provided by: MetaStock. |
| |
| The momentum reversal is also captured by the relative strength index (RSI) with its break below 50. The indicator moved above 70 in March and formed a lower high in July. Despite a five-month advance back above 18000, the RSI did not reach its prior high and momentum was not as strong. Based on weekly closing prices, a negative divergence formed and the indicator went on to break the June trendline as well. More important, the RSI moved below 50, and this puts the indicator in the bottom half of its range (zero to 100). Momentum now favors the bears and lower prices are expected. |
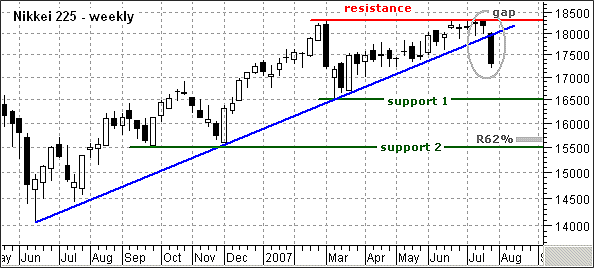
| Figure 1 dealt with the reversal, and now, Figure 2 looks at downside targets. The first downside target is based on the March low around 16500. It is also possible that a large double is forming with the March and July highs. A break below the March low at 16500 would confirm this top and project even further weakness. |

|
| FIGURE 2: NIKKEI 225, WEEKLY. While Figure 1 examined the reversal, Figure 2 looks at downside targets. |
| Graphic provided by: MetaStock. |
| |
| The next support or target is around 15500. This is based on the September–December 2006 lows and a 62% retracement of the entire advance. The index bounced off 15500 twice last year and there is obviously a lot of support here. This is further reinforced by the Fibonacci retracement. Corrections are part of the natural ebb and flow of an uptrend. The advance lasted for a year and a multimonth correction is entirely feasible. The index is up over 25% since last June but a 15% decline would also be quite feasible. |
Arthur Hill is currently editor of TDTrader.com, a website specializing in trading strategies, sector/industry specific breadth stats and overall technical analysis. He passed the Society of Technical Analysts (STA London) diploma exam with distinction is a Certified Financial Technician (CFTe). Prior to TD Trader, he was the Chief Technical Analyst for Stockcharts.com and the main contributor to the ChartSchool.
| Title: | Editor |
| Company: | TDTrader.com |
| Address: | Willem Geetsstraat 17 |
| Mechelen, B2800 | |
| Phone # for sales: | 3215345465 |
| Website: | www.tdtrader.com |
| E-mail address: | arthurh@tdtrader.com |
Traders' Resource Links | |
| TDTrader.com has not added any product or service information to TRADERS' RESOURCE. | |
Click here for more information about our publications!
PRINT THIS ARTICLE

Request Information From Our Sponsors
- VectorVest, Inc.
- Executive Premier Workshop
- One-Day Options Course
- OptionsPro
- Retirement Income Workshop
- Sure-Fire Trading Systems (VectorVest, Inc.)
- Trading as a Business Workshop
- VectorVest 7 EOD
- VectorVest 7 RealTime/IntraDay
- VectorVest AutoTester
- VectorVest Educational Services
- VectorVest OnLine
- VectorVest Options Analyzer
- VectorVest ProGraphics v6.0
- VectorVest ProTrader 7
- VectorVest RealTime Derby Tool
- VectorVest Simulator
- VectorVest Variator
- VectorVest Watchdog
- StockCharts.com, Inc.
- Candle Patterns
- Candlestick Charting Explained
- Intermarket Technical Analysis
- John Murphy on Chart Analysis
- John Murphy's Chart Pattern Recognition
- John Murphy's Market Message
- MurphyExplainsMarketAnalysis-Intermarket Analysis
- MurphyExplainsMarketAnalysis-Visual Analysis
- StockCharts.com
- Technical Analysis of the Financial Markets
- The Visual Investor
