HOT TOPICS LIST
- MACD
- Fibonacci
- RSI
- Gann
- ADXR
- Stochastics
- Volume
- Triangles
- Futures
- Cycles
- Volatility
- ZIGZAG
- MESA
- Retracement
- Aroon
INDICATORS LIST
LIST OF TOPICS
PRINT THIS ARTICLE
by Gary Grosschadl
It's been a hard week for the indexes. The NASDAQ, for one, lost 4.66% for the week, or 125 points. What does the monthly chart reveal?
Position: Sell
Gary Grosschadl
Independent Canadian equities trader and technical analyst based in Peterborough
Ontario, Canada.
PRINT THIS ARTICLE
CANDLESTICK CHARTING
The NASDAQ Composite's Monthly Chart
07/30/07 09:12:34 AMby Gary Grosschadl
It's been a hard week for the indexes. The NASDAQ, for one, lost 4.66% for the week, or 125 points. What does the monthly chart reveal?
Position: Sell
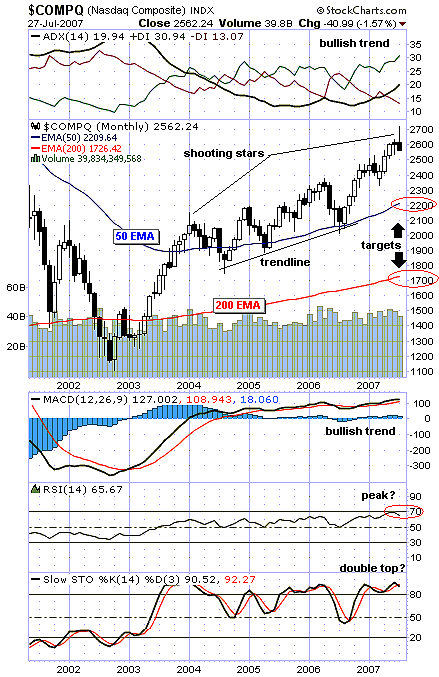
| The NASDAQ's monthly chart (Figure 1) often serves well as the bigger picture can come into focus. The big picture shows the fantastic recovery since late 2002 as the index more than doubled. However, there are other things to consider. |
| Note the first-year action off the bottom. It doubled from the low of 1100 to 2200. A shooting star appeared at that level and hinted at a possible top. A three-month decline was rescued by the 50-period exponential moving average (EMA), and then another two-month decline ended with a hammer candlestick. Now a similar shooting star candlestick appears. It is not important whether the small body is white or black, as either way the close is weak. The ideal shooting star gaps away from the previous candle, but nevertheless this can serve as a possible top warning. |

|
| FIGURE 1: NASDAQ COMPOSITE, MONTHLY. This chart suggests downside targets. |
| Graphic provided by: StockCharts.com. |
| |
| The displayed indicators are a mixed bag of positive and negative. The directional movement indicator at the top of the chart shows a bullish trend in place, but this tends to be a lagging indicator — still, a point for the bulls. The moving average convergence/divergence (MACD) below the chart also shows a bullish trend in place. The next two indicators are more sensitive and react quicker than the other two. The relative strength index (RSI) shows a downturn from the 70 level, suggesting a possible peak. Finally, the stochastic oscillator shows an overbought level above 80 and looks suspiciously like a possible double top. |
| Two downside targets are mused, with the first being the 50-period EMA currently near 2200. Note how this coincides with the lower trendline. This is a sizable correction in the short term, but if it bounces here, the long term still shows the uptrend is alive and well. Failure at this 50-day EMA brings the lower support target into play, with the ever-important 200-period EMA currently near 1700. |
| In summary, the shooting star candlestick indicates a possible downturn ahead. A move to the lower trendline or the 50-period EMA is a possibility. Stronger support is offered by the 200-day EMA. |
Independent Canadian equities trader and technical analyst based in Peterborough
Ontario, Canada.
| Website: | www.whatsonsale.ca/financial.html |
| E-mail address: | gwg7@sympatico.ca |
Click here for more information about our publications!
PRINT THIS ARTICLE

Request Information From Our Sponsors
- StockCharts.com, Inc.
- Candle Patterns
- Candlestick Charting Explained
- Intermarket Technical Analysis
- John Murphy on Chart Analysis
- John Murphy's Chart Pattern Recognition
- John Murphy's Market Message
- MurphyExplainsMarketAnalysis-Intermarket Analysis
- MurphyExplainsMarketAnalysis-Visual Analysis
- StockCharts.com
- Technical Analysis of the Financial Markets
- The Visual Investor
- VectorVest, Inc.
- Executive Premier Workshop
- One-Day Options Course
- OptionsPro
- Retirement Income Workshop
- Sure-Fire Trading Systems (VectorVest, Inc.)
- Trading as a Business Workshop
- VectorVest 7 EOD
- VectorVest 7 RealTime/IntraDay
- VectorVest AutoTester
- VectorVest Educational Services
- VectorVest OnLine
- VectorVest Options Analyzer
- VectorVest ProGraphics v6.0
- VectorVest ProTrader 7
- VectorVest RealTime Derby Tool
- VectorVest Simulator
- VectorVest Variator
- VectorVest Watchdog
