HOT TOPICS LIST
- MACD
- Fibonacci
- RSI
- Gann
- ADXR
- Stochastics
- Volume
- Triangles
- Futures
- Cycles
- Volatility
- ZIGZAG
- MESA
- Retracement
- Aroon
INDICATORS LIST
LIST OF TOPICS
PRINT THIS ARTICLE
by David Penn
A reversal pattern brings the bearishness of the stock market to the world of bonds.
Position: N/A
David Penn
Technical Writer for Technical Analysis of STOCKS & COMMODITIES magazine, Working-Money.com, and Traders.com Advantage.
PRINT THIS ARTICLE
CANDLESTICK CHARTING
Dark Cloud Cover Caps Bond Rally
07/30/07 09:45:08 AMby David Penn
A reversal pattern brings the bearishness of the stock market to the world of bonds.
Position: N/A
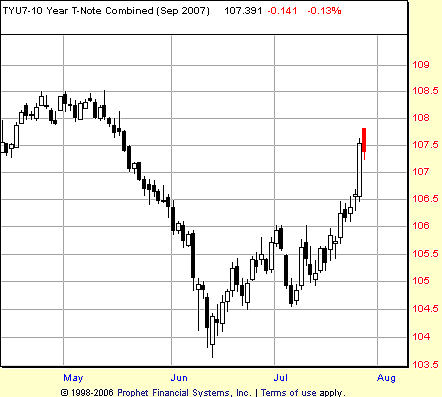
| While the stock market was busy putting the finishing touches on the most bearish week in months, the market for the September 10-year Treasury note was putting in a finishing touch of its own. This finishing touch is also known as "dark cloud cover." The dark cloud cover develops when an advancing market — either in a mature rally or as part of a bounce in a downtrend — opens up and closes down, penetrating into the real body of the candlestick that preceded it. |
| Steve Nison, writing in his book Japanese Candlestick Charting Techniques, notes that the greater the degree of penetration into the previous real body, the more powerful the warning of incipient reversal. If the bearish engulfing pattern, for example, represents total penetration (really, more than that since it "engulfs" the prior candlestick line), the dark cloud cover can range from a high degree of penetration (such as 50% or more) or a relatively mild degree of penetration such as the dark cloud cover, as shown in Figure 1. |

|
| FIGURE 1: 10-YEAR TREASURY NOTE, SEPTEMBER FUTURES, DAILY. This dark cloud cover pattern in the September T-note suggests that the six-week rally may have run its course for the time being. |
| Graphic provided by: Prophet Financial, Inc. |
| |
| We can see the result of the 10-year Treasury notes' encounter with bearish engulfing patterns in the price action at the very beginning of July, which led to a sharp, two-day selloff. |
| So what can traders make of the dark cloud cover that appears in late July? While the penetration of the dark cloud cover is relatively shadowed, the context in which the pattern appears may make it more significant than it might otherwise be. That context is the potential price resistance zone between 108.5 and 107.5. This zone developed as a result of a mid-April to mid-May consolidation during the September T-note's decline from the March highs north of 109 to the mid-June lows south of 104. |
| The combination of a potentially weak dark cloud cover pattern and true price resistance could make for sideways rather than sharply negative price action in the September T-note going forward. Trading confirmation of the dark cloud cover pattern, however, will not be achieved until the low of the session being "cloud covered" is taken out on a closing basis. That means a close below, roughly, 106.5. |
Technical Writer for Technical Analysis of STOCKS & COMMODITIES magazine, Working-Money.com, and Traders.com Advantage.
| Title: | Technical Writer |
| Company: | Technical Analysis, Inc. |
| Address: | 4757 California Avenue SW |
| Seattle, WA 98116 | |
| Phone # for sales: | 206 938 0570 |
| Fax: | 206 938 1307 |
| Website: | www.Traders.com |
| E-mail address: | DPenn@traders.com |
Traders' Resource Links | |
| Charting the Stock Market: The Wyckoff Method -- Books | |
| Working-Money.com -- Online Trading Services | |
| Traders.com Advantage -- Online Trading Services | |
| Technical Analysis of Stocks & Commodities -- Publications and Newsletters | |
| Working Money, at Working-Money.com -- Publications and Newsletters | |
| Traders.com Advantage -- Publications and Newsletters | |
| Professional Traders Starter Kit -- Software | |
Click here for more information about our publications!
PRINT THIS ARTICLE

Request Information From Our Sponsors
- StockCharts.com, Inc.
- Candle Patterns
- Candlestick Charting Explained
- Intermarket Technical Analysis
- John Murphy on Chart Analysis
- John Murphy's Chart Pattern Recognition
- John Murphy's Market Message
- MurphyExplainsMarketAnalysis-Intermarket Analysis
- MurphyExplainsMarketAnalysis-Visual Analysis
- StockCharts.com
- Technical Analysis of the Financial Markets
- The Visual Investor
- VectorVest, Inc.
- Executive Premier Workshop
- One-Day Options Course
- OptionsPro
- Retirement Income Workshop
- Sure-Fire Trading Systems (VectorVest, Inc.)
- Trading as a Business Workshop
- VectorVest 7 EOD
- VectorVest 7 RealTime/IntraDay
- VectorVest AutoTester
- VectorVest Educational Services
- VectorVest OnLine
- VectorVest Options Analyzer
- VectorVest ProGraphics v6.0
- VectorVest ProTrader 7
- VectorVest RealTime Derby Tool
- VectorVest Simulator
- VectorVest Variator
- VectorVest Watchdog
