HOT TOPICS LIST
- MACD
- Fibonacci
- RSI
- Gann
- ADXR
- Stochastics
- Volume
- Triangles
- Futures
- Cycles
- Volatility
- ZIGZAG
- MESA
- Retracement
- Aroon
INDICATORS LIST
LIST OF TOPICS
PRINT THIS ARTICLE
by David Penn
Bearish candlestick patterns anticipate a correction in the British pound/US dollar currency pair.
Position: N/A
David Penn
Technical Writer for Technical Analysis of STOCKS & COMMODITIES magazine, Working-Money.com, and Traders.com Advantage.
PRINT THIS ARTICLE
CANDLESTICK CHARTING
Topping The Pound
07/27/07 11:50:47 AMby David Penn
Bearish candlestick patterns anticipate a correction in the British pound/US dollar currency pair.
Position: N/A
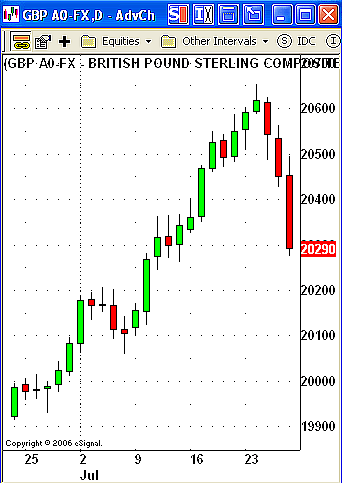
| In the same way that multiple indicators can help confirm each other, so can multiple candlestick patterns give traders greater confidence that the moves they anticipate will actually take place. An excellent example of this has developed in the British pound/US dollar currency pair (GBP/USD) here in late July (Figure 1). The pound has been beating the pants of the greenback for more than a month, with the GBP/USD rallying from 1.9696 in the first half of June to a closing high of 2.0618 in the second half of July. |
| The day of that closing high, however, saw the GBP/USD form a shooting star candlestick line. Shooting stars are classic single-line patterns, featuring a smallish real body and a long shadow that extends to the upside. Shooting stars reflect a dramatic intraday dropoff in bullish momentum and, in the proper context, can signal a significant correction or even a reversal. Although it might not pass the most discriminating scrutiny, I consider the line that develops after the shooting star to be a bearish engulfing line. In continuous, 24-hour markets like foreign exchange, getting the sort of gap up that starts a bearish engulfing line in markets like stocks and futures can be tricky. I'm giving this one the benefit of the doubt because the difference between the closing high of the shooting star (the high of the real body) and the opening high of what I'm treating as a bearish engulfing line (the high of the real body also) is only 4 pips. Since the spread on the GBP/USD is often about 4 pips, I feel the highs of the real bodies are comparable. |

|
| FIGURE 1: BRITISH POUND/US DOLLAR, DAILY. A shooting star candlestick line is followed by a bearish engulfing line. Together, they help form an evening star that helped traders take advantage of a sharp correction in the GBP/USD. |
| Graphic provided by: eSignal. |
| |
| Another point worth noting is the way the bearish engulfing pattern engulfs not just one but two previous candlestick lines. In the context of a shooting star in a mature advance, the engulfing of two bullish lines at the top seems significant — and significantly bearish. And if the shooting star and the bearish engulfing pattern aren't convincing enough, the fact that they appear consecutively here means that a third bearish reversal pattern — an evening star — has been formed. The evening star pattern consists of three candlestick lines: the first is a bullish line, the second is a star of some sort or spinning top, and the third is a bearish line that penetrates significantly into the real body of the initial candlestick line in the pattern. Since we've considered that third line to be an engulfing pattern, we know it meets the criteria of 50% or better penetration. |
| How do you actually trade these patterns? I am a big believer in confirming closes when taking positions. That means that when the shooting star appears, I am looking for the market to close below the low of that shooting star in order to confirm. In this case, that would have allowed for a short entry at 2.0540 on July 25. The confirming close for the bearish engulfing pattern would have occurred on the following day at 2.0449. This, by the way, also would have represented the confirming close for the evening star pattern as well. |
| As of this writing, both trades would be well in the money to the tune of 250 and 159 pips, respectively. |
Technical Writer for Technical Analysis of STOCKS & COMMODITIES magazine, Working-Money.com, and Traders.com Advantage.
| Title: | Technical Writer |
| Company: | Technical Analysis, Inc. |
| Address: | 4757 California Avenue SW |
| Seattle, WA 98116 | |
| Phone # for sales: | 206 938 0570 |
| Fax: | 206 938 1307 |
| Website: | www.Traders.com |
| E-mail address: | DPenn@traders.com |
Traders' Resource Links | |
| Charting the Stock Market: The Wyckoff Method -- Books | |
| Working-Money.com -- Online Trading Services | |
| Traders.com Advantage -- Online Trading Services | |
| Technical Analysis of Stocks & Commodities -- Publications and Newsletters | |
| Working Money, at Working-Money.com -- Publications and Newsletters | |
| Traders.com Advantage -- Publications and Newsletters | |
| Professional Traders Starter Kit -- Software | |
Click here for more information about our publications!
PRINT THIS ARTICLE

Request Information From Our Sponsors
- StockCharts.com, Inc.
- Candle Patterns
- Candlestick Charting Explained
- Intermarket Technical Analysis
- John Murphy on Chart Analysis
- John Murphy's Chart Pattern Recognition
- John Murphy's Market Message
- MurphyExplainsMarketAnalysis-Intermarket Analysis
- MurphyExplainsMarketAnalysis-Visual Analysis
- StockCharts.com
- Technical Analysis of the Financial Markets
- The Visual Investor
- VectorVest, Inc.
- Executive Premier Workshop
- One-Day Options Course
- OptionsPro
- Retirement Income Workshop
- Sure-Fire Trading Systems (VectorVest, Inc.)
- Trading as a Business Workshop
- VectorVest 7 EOD
- VectorVest 7 RealTime/IntraDay
- VectorVest AutoTester
- VectorVest Educational Services
- VectorVest OnLine
- VectorVest Options Analyzer
- VectorVest ProGraphics v6.0
- VectorVest ProTrader 7
- VectorVest RealTime Derby Tool
- VectorVest Simulator
- VectorVest Variator
- VectorVest Watchdog
