HOT TOPICS LIST
- MACD
- Fibonacci
- RSI
- Gann
- ADXR
- Stochastics
- Volume
- Triangles
- Futures
- Cycles
- Volatility
- ZIGZAG
- MESA
- Retracement
- Aroon
INDICATORS LIST
LIST OF TOPICS
PRINT THIS ARTICLE
by David Penn
The rally in the NASDAQ 100 lasted almost a month before a head & shoulders pattern signaled a correction.
Position: N/A
David Penn
Technical Writer for Technical Analysis of STOCKS & COMMODITIES magazine, Working-Money.com, and Traders.com Advantage.
PRINT THIS ARTICLE
HEAD & SHOULDERS
The QQQQ's Intraday Head & Shoulders Top
07/27/07 09:51:26 AMby David Penn
The rally in the NASDAQ 100 lasted almost a month before a head & shoulders pattern signaled a correction.
Position: N/A
| I've had much better luck finding many of the traditional chart patterns such as triangles, diamonds, and head & shoulders in intraday charts compared to daily or weekly charts. It would be one thing if I were simply canvassing all of the intraday price action in all the stocks of the Wilshire 5000 for chart patterns. But many of the patterns I find are in exchange traded funds — even exchange traded index funds — which are a far more restrictive survey sample. |

|
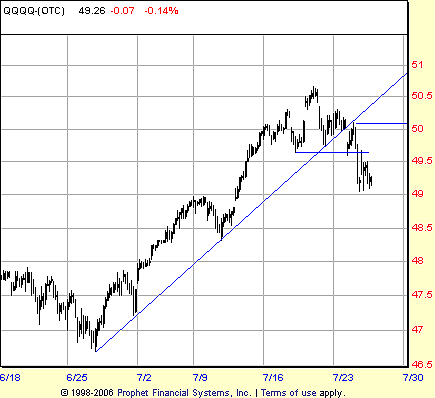
| FIGURE 1: NASDAQ 100 UNIT TRUST (QQQQ), HOURLY. This head & shoulders top emerged at the end of a nearly month-long advance in the NASDAQ 100. Note also how the head & shoulders pattern — and its breakdown — also complete a 1-2-3 trend reversal. |
| Graphic provided by: Prophet Financial, Inc. |
| |
| The head & shoulders pattern in the QQQQ was as close to ideal as you are likely to find. Developing over the days between July 13 and 24, the pattern has the requisite shape of two peaks ("shoulders") separated by a higher peak ("head"). The actual breakdown from this pattern occurred early in the afternoon of July 24, with the QQQQ falling nearly 60 cents in an hour. The market bounced — or, rather, moved sideways — for a few days before resuming the decline. Given the size of the head & shoulders pattern, about $1.00, and a breakdown level at about 49.64, we can project a minimum move to the 48.60–48.50 area. Note that this coincides with potential support at the morning low from July 11 just south of 48.50. |
| In addition, note how the head & shoulders pattern coincides with the 1-2-3 trend reversal (Figure 1). The QQQQ broke down below the trendline that supported the rally from late June on the morning of July 24 to form the "1" of the 1-2-3 trend reversal, and the bounce hours later represented stage 2. Stage 3 of the reversal followed shortly thereafter as the low from stage 1 of the 1-2-3 trend reversal was taken out to the downside. |
Technical Writer for Technical Analysis of STOCKS & COMMODITIES magazine, Working-Money.com, and Traders.com Advantage.
| Title: | Technical Writer |
| Company: | Technical Analysis, Inc. |
| Address: | 4757 California Avenue SW |
| Seattle, WA 98116 | |
| Phone # for sales: | 206 938 0570 |
| Fax: | 206 938 1307 |
| Website: | www.Traders.com |
| E-mail address: | DPenn@traders.com |
Traders' Resource Links | |
| Charting the Stock Market: The Wyckoff Method -- Books | |
| Working-Money.com -- Online Trading Services | |
| Traders.com Advantage -- Online Trading Services | |
| Technical Analysis of Stocks & Commodities -- Publications and Newsletters | |
| Working Money, at Working-Money.com -- Publications and Newsletters | |
| Traders.com Advantage -- Publications and Newsletters | |
| Professional Traders Starter Kit -- Software | |
Click here for more information about our publications!
PRINT THIS ARTICLE

Request Information From Our Sponsors
- StockCharts.com, Inc.
- Candle Patterns
- Candlestick Charting Explained
- Intermarket Technical Analysis
- John Murphy on Chart Analysis
- John Murphy's Chart Pattern Recognition
- John Murphy's Market Message
- MurphyExplainsMarketAnalysis-Intermarket Analysis
- MurphyExplainsMarketAnalysis-Visual Analysis
- StockCharts.com
- Technical Analysis of the Financial Markets
- The Visual Investor
- VectorVest, Inc.
- Executive Premier Workshop
- One-Day Options Course
- OptionsPro
- Retirement Income Workshop
- Sure-Fire Trading Systems (VectorVest, Inc.)
- Trading as a Business Workshop
- VectorVest 7 EOD
- VectorVest 7 RealTime/IntraDay
- VectorVest AutoTester
- VectorVest Educational Services
- VectorVest OnLine
- VectorVest Options Analyzer
- VectorVest ProGraphics v6.0
- VectorVest ProTrader 7
- VectorVest RealTime Derby Tool
- VectorVest Simulator
- VectorVest Variator
- VectorVest Watchdog
