HOT TOPICS LIST
- MACD
- Fibonacci
- RSI
- Gann
- ADXR
- Stochastics
- Volume
- Triangles
- Futures
- Cycles
- Volatility
- ZIGZAG
- MESA
- Retracement
- Aroon
INDICATORS LIST
LIST OF TOPICS
PRINT THIS ARTICLE
by David Penn
A late June bottom sets the stage for the last move higher in the bull market that began in March.
Position: N/A
David Penn
Technical Writer for Technical Analysis of STOCKS & COMMODITIES magazine, Working-Money.com, and Traders.com Advantage.
PRINT THIS ARTICLE
ELLIOTT WAVE
A Working Wave Count For The S&P 500
07/26/07 08:43:33 AMby David Penn
A late June bottom sets the stage for the last move higher in the bull market that began in March.
Position: N/A
| While it may seem obvious to you, the fact that the Standard & Poor's 500 is in a bull market often appears lost on a frightening number of observers — many of whom are quite well compensated for their analysis. Given the mass panic that accompanied the clearly "buyable" low in the spring of 2007, it was pretty easy work to consider the panic that accompanied the summer correction in June as just another opportunity for weak hands to sell to stronger ones. |

|
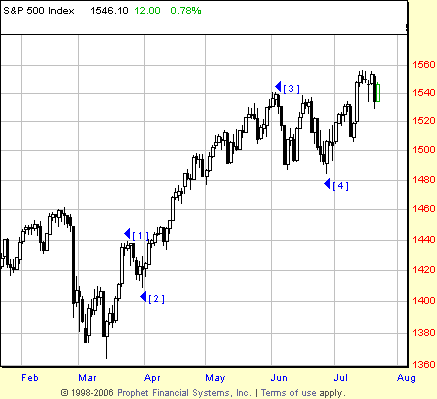
| FIGURE 1: S&P 500, DAILY. An Elliott wave analysis of the S&P 500 since the March 2007 bottom posits the market as rallying into the fifth and final wave of this bull market. |
| Graphic provided by: Prophet Financial, Inc. |
| |
| My Elliott wave analysis of the S&P 500 has varied over the months and years. But one thing I have done consistently is to warn traders and investors away from some of the bearishness that has monopolized Elliott wave commentary ever since the market topped in 2003. I say that as a penitent: I was as bearish as any other Elliott wave technician during the first few years of the 2000–02/2003 bear market. And though I recognized the bullishness of the spring 2003 bottom, I was among those Elliotticians looking for The Top for too long after that bottom. |
| Fortunately, if you are following the market technically, you may be wrong, but you are not likely to be wrong for long. While other Elliott wave technicians continued to anticipate the earth-shattering "ka-boom" as the markets rallied to ever-higher highs, I decided to simply count the waves as I saw them, and to let those counts take me wherever they chose to. It is true that there is no pain worse than losing money. But if there is an infirmity that might run a close second, then the discomfort of finding oneself on the sidelines as a market moves higher, and higher, and higher, might be it. |

|
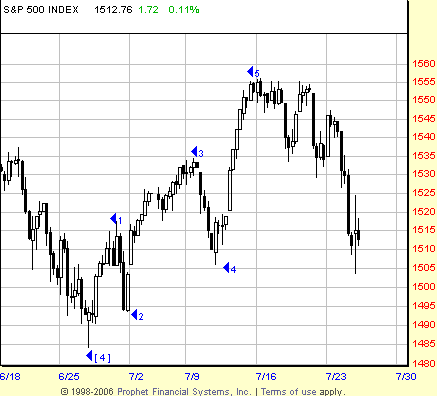
| FIGURE 2: S&P 500, TWO-HOUR. An Elliott wave analysis of the S&P 500 since making a wave 4 bottom in late June. Working wave counts are highly fluid and subject to change, but this count suggests strength in the S&P 500 for the next few weeks at least, as the market recovers from a second-wave correction. |
| Graphic provided by: Prophet Financial, Inc. |
| |
| The wave counts in Figures 1 and 2 are my latest attempt to map the S&P 500 using Elliott waves. My last effort, approximately one month ago, suggested that the summer correction was likely a fourth wave ("A Fourth Wave Correction?" Traders.com Advantage, June 25, 2007). The S&P 500 is up more than 30 points since that call was made and has broken out above the early June high (a high that I believe represented a third wave peak). Figure 1 serves as a sort of update to that earlier article. Figure 2 takes a closer look at the S&P 500 since that fourth wave ended in late June. The severity of the market plunge in the second half of July has all the usual suspects in a panic. This kind of panic is to me symptomatic of what you find during wave 2 corrections in a bull market. Wave 2s, and wave 2 lows in particular, often feature sentiment that is more negative even than at the actual bottom. Recall that while the S&P 500 made its secular bear market bottom in 1974, most people think of the bear market not truly ending until after the 1982 recession. Part of that has to do with the fact that the bear market bottom, in inflation-adjusted terms, did not occur until 1982. But a large part of that has to do with the psychology and social mood that accompanies various wave patterns. |
| If this is the case, that the S&P 500 is making a wave 2 correction low, then the market should see some support between 1510 and 1490. If support is found at these levels, then a powerful wave 3 advance that sets a new, all-time high should follow shortly thereafter. A last note: the wave count shown in Figure 2 is imperfect insofar as wave 4 overlaps slightly into the price territory of wave 1. Generally, this is an Elliott wave no-no. Robert Prechter and AJ Frost in Elliott Wave Principle allow exceptions to this rule when dealing, for example, with commodity price charts, blaming the existence of leverage. I'm allowing this working wave count not only because it has a good look, but also because it measures out very well. If you multiply the amplitude of wave 1 by 1.618 and the amplitude of wave 3 by 0.618, as I do with every wave count to get a wave 5 target, then you get a target range between 1555 and 1559. Until something better comes along, I'm sticking with this one. |
Technical Writer for Technical Analysis of STOCKS & COMMODITIES magazine, Working-Money.com, and Traders.com Advantage.
| Title: | Technical Writer |
| Company: | Technical Analysis, Inc. |
| Address: | 4757 California Avenue SW |
| Seattle, WA 98116 | |
| Phone # for sales: | 206 938 0570 |
| Fax: | 206 938 1307 |
| Website: | www.Traders.com |
| E-mail address: | DPenn@traders.com |
Traders' Resource Links | |
| Charting the Stock Market: The Wyckoff Method -- Books | |
| Working-Money.com -- Online Trading Services | |
| Traders.com Advantage -- Online Trading Services | |
| Technical Analysis of Stocks & Commodities -- Publications and Newsletters | |
| Working Money, at Working-Money.com -- Publications and Newsletters | |
| Traders.com Advantage -- Publications and Newsletters | |
| Professional Traders Starter Kit -- Software | |
Click here for more information about our publications!
Comments
Date: 07/31/07Rank: 5Comment:

Request Information From Our Sponsors
- StockCharts.com, Inc.
- Candle Patterns
- Candlestick Charting Explained
- Intermarket Technical Analysis
- John Murphy on Chart Analysis
- John Murphy's Chart Pattern Recognition
- John Murphy's Market Message
- MurphyExplainsMarketAnalysis-Intermarket Analysis
- MurphyExplainsMarketAnalysis-Visual Analysis
- StockCharts.com
- Technical Analysis of the Financial Markets
- The Visual Investor
- VectorVest, Inc.
- Executive Premier Workshop
- One-Day Options Course
- OptionsPro
- Retirement Income Workshop
- Sure-Fire Trading Systems (VectorVest, Inc.)
- Trading as a Business Workshop
- VectorVest 7 EOD
- VectorVest 7 RealTime/IntraDay
- VectorVest AutoTester
- VectorVest Educational Services
- VectorVest OnLine
- VectorVest Options Analyzer
- VectorVest ProGraphics v6.0
- VectorVest ProTrader 7
- VectorVest RealTime Derby Tool
- VectorVest Simulator
- VectorVest Variator
- VectorVest Watchdog
