HOT TOPICS LIST
- MACD
- Fibonacci
- RSI
- Gann
- ADXR
- Stochastics
- Volume
- Triangles
- Futures
- Cycles
- Volatility
- ZIGZAG
- MESA
- Retracement
- Aroon
INDICATORS LIST
LIST OF TOPICS
PRINT THIS ARTICLE
by Gary Grosschadl
Several candlestick warnings hint at the coming downside.
Position: Sell
Gary Grosschadl
Independent Canadian equities trader and technical analyst based in Peterborough
Ontario, Canada.
PRINT THIS ARTICLE
CHART ANALYSIS
Sierra Wireless Heading Lower
07/27/07 08:56:00 AMby Gary Grosschadl
Several candlestick warnings hint at the coming downside.
Position: Sell
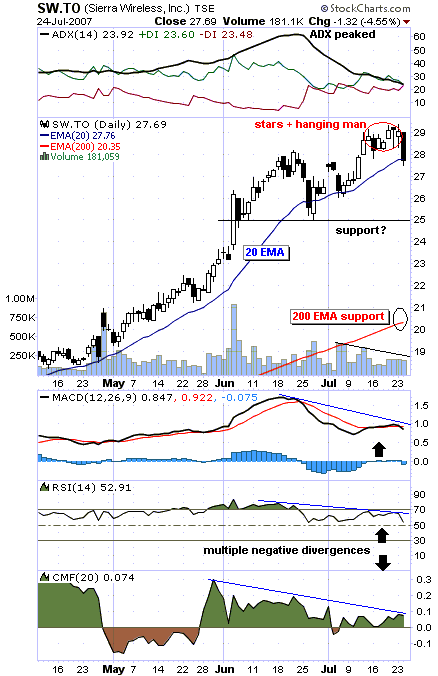
| Even before this last black candlestick, propects were looking dubious for this high-tech player trading in Toronto. As this daily chart shows, a series of "stars" (small-bodied candlesticks) and a hanging man candlestick hinted that a further rise was unlikely (Figure 1). When a stock has peaked, small-bodied candlesticks often appear. The appearance of a hanging man candlestick (small black body with a long tail) also shows a danger signal. |
| As always, it is wise to look for collaborating evidence, and several indicators display this. At the top of the chart, the average directional movement index (ADX) peaked several weeks ago, showing that the strong previous uptrend was quickly weakening. Meanwhile, the volume pattern was also declining. Stocks rising on weakening volume is usually suspect. Below Figure 1, more negative divergences appear via the moving average convergence/divergence (MACD), the relative strength index (RSI), and the Chaikin money flow indicator (CMF). When stocks increase while indicators head the opposite way, a correction is often likely. |

|
| FIGURE 1: SW, DAILY. This chart shows that a strong rise may be challenged. |
| Graphic provided by: StockCharts.com. |
| |
| The close under this stock's 20-day exponential moving average (EMA) likely will bring at least a test of the previous support level at $25. Failure there may bring a deeper correction to the ever-prominent 200-day EMA. The 200-period moving average often is a trading target, as this is deemed to be strong support. |
| In conclusion, more downside is indicated. The question, as always, revolves around support targets. Watch for the trading action at the $25 level to gauge whether further downside comes into play. Should temporary support be offered at $25, be wary, as the stock will then be resisted by the overhead 20-day EMA, an important upside test for any reversal. |
Independent Canadian equities trader and technical analyst based in Peterborough
Ontario, Canada.
| Website: | www.whatsonsale.ca/financial.html |
| E-mail address: | gwg7@sympatico.ca |
Click here for more information about our publications!
PRINT THIS ARTICLE

Request Information From Our Sponsors
- StockCharts.com, Inc.
- Candle Patterns
- Candlestick Charting Explained
- Intermarket Technical Analysis
- John Murphy on Chart Analysis
- John Murphy's Chart Pattern Recognition
- John Murphy's Market Message
- MurphyExplainsMarketAnalysis-Intermarket Analysis
- MurphyExplainsMarketAnalysis-Visual Analysis
- StockCharts.com
- Technical Analysis of the Financial Markets
- The Visual Investor
- VectorVest, Inc.
- Executive Premier Workshop
- One-Day Options Course
- OptionsPro
- Retirement Income Workshop
- Sure-Fire Trading Systems (VectorVest, Inc.)
- Trading as a Business Workshop
- VectorVest 7 EOD
- VectorVest 7 RealTime/IntraDay
- VectorVest AutoTester
- VectorVest Educational Services
- VectorVest OnLine
- VectorVest Options Analyzer
- VectorVest ProGraphics v6.0
- VectorVest ProTrader 7
- VectorVest RealTime Derby Tool
- VectorVest Simulator
- VectorVest Variator
- VectorVest Watchdog
