HOT TOPICS LIST
- MACD
- Fibonacci
- RSI
- Gann
- ADXR
- Stochastics
- Volume
- Triangles
- Futures
- Cycles
- Volatility
- ZIGZAG
- MESA
- Retracement
- Aroon
INDICATORS LIST
LIST OF TOPICS
PRINT THIS ARTICLE
by Arthur Hill
Intuit shows signs of accumulation and relative strength within its consolidation, pointing to a breakout.
Position: Accumulate
Arthur Hill
Arthur Hill is currently editor of TDTrader.com, a website specializing in trading strategies, sector/industry specific breadth stats and overall technical analysis. He passed the Society of Technical Analysts (STA London) diploma exam with distinction is a Certified Financial Technician (CFTe). Prior to TD Trader, he was the Chief Technical Analyst for Stockcharts.com and the main contributor to the ChartSchool.
PRINT THIS ARTICLE
ACCUM./DIST. CHAIKIN
Intuit Attempts A Breakout
07/25/07 08:44:52 AMby Arthur Hill
Intuit shows signs of accumulation and relative strength within its consolidation, pointing to a breakout.
Position: Accumulate
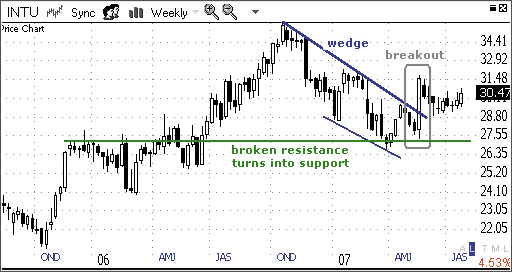
| Figure 1 shows a long-term perspective for Intuit (INTU) and the May breakout. The stock surged and then declined from October to April with a falling wedge. Broken resistance around 27 turned into support, and the stock firmed in March and April. The real kicker came in May when the stock surged above wedge resistance and reversed the downtrend. This breakout occurred with a long white candlestick and the stock held the breakout over the last few months. |

|
| FIGURE 1: INTUIT, WEEKLY. Here's a long-term perspective for INTU and the May breakout. |
| Graphic provided by: Telechart 2007. |
| |
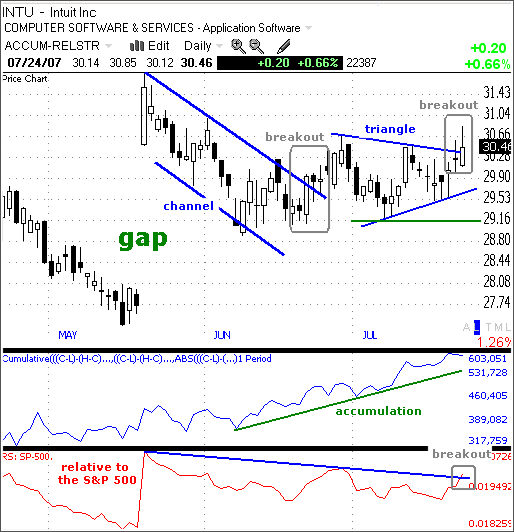
| Turning to the daily chart (Figure 2), we can see that the May surge consisted of a large gap. This is even more bullish and shows strong buying pressure. The stock jumped more than 10% in one day and then corrected to around 29 with a falling price channel. INTU broke channel resistance in the second half of June and then consolidated in July. The consolidation formed a triangle, and INTU is making a breakout bid. A move above triangle resistance would be bullish and signal a continuation of the May advance. The lower boundary of the triangle marks key support at 29. Failure to break out and a move below this level would be bearish for INTU. |

|
| FIGURE 2: INTUIT, DAILY. The May surge consisted of a large gap. |
| Graphic provided by: Telechart 2007. |
| |
| Relative strength and signs of accumulation point to a breakout. The blue line shows the accumulation-distribution line, and this indicator has been moving higher since April. Even when the stock pulled back in May and June, the indicator kept on moving higher and hit a new high in July. This shows signs of buying pressure. The red line shows the price relative, which compares INTU to the Standard & Poor's 500. The stock had been lagging from mid-May to July, but the indicator turned up over the last few days and broke the trendline. Relative strength is turning up, which is also positive for the stock. |
Arthur Hill is currently editor of TDTrader.com, a website specializing in trading strategies, sector/industry specific breadth stats and overall technical analysis. He passed the Society of Technical Analysts (STA London) diploma exam with distinction is a Certified Financial Technician (CFTe). Prior to TD Trader, he was the Chief Technical Analyst for Stockcharts.com and the main contributor to the ChartSchool.
| Title: | Editor |
| Company: | TDTrader.com |
| Address: | Willem Geetsstraat 17 |
| Mechelen, B2800 | |
| Phone # for sales: | 3215345465 |
| Website: | www.tdtrader.com |
| E-mail address: | arthurh@tdtrader.com |
Traders' Resource Links | |
| TDTrader.com has not added any product or service information to TRADERS' RESOURCE. | |
Click here for more information about our publications!
Comments

Request Information From Our Sponsors
- StockCharts.com, Inc.
- Candle Patterns
- Candlestick Charting Explained
- Intermarket Technical Analysis
- John Murphy on Chart Analysis
- John Murphy's Chart Pattern Recognition
- John Murphy's Market Message
- MurphyExplainsMarketAnalysis-Intermarket Analysis
- MurphyExplainsMarketAnalysis-Visual Analysis
- StockCharts.com
- Technical Analysis of the Financial Markets
- The Visual Investor
- VectorVest, Inc.
- Executive Premier Workshop
- One-Day Options Course
- OptionsPro
- Retirement Income Workshop
- Sure-Fire Trading Systems (VectorVest, Inc.)
- Trading as a Business Workshop
- VectorVest 7 EOD
- VectorVest 7 RealTime/IntraDay
- VectorVest AutoTester
- VectorVest Educational Services
- VectorVest OnLine
- VectorVest Options Analyzer
- VectorVest ProGraphics v6.0
- VectorVest ProTrader 7
- VectorVest RealTime Derby Tool
- VectorVest Simulator
- VectorVest Variator
- VectorVest Watchdog
