HOT TOPICS LIST
- MACD
- Fibonacci
- RSI
- Gann
- ADXR
- Stochastics
- Volume
- Triangles
- Futures
- Cycles
- Volatility
- ZIGZAG
- MESA
- Retracement
- Aroon
INDICATORS LIST
LIST OF TOPICS
PRINT THIS ARTICLE
by Paolo Pezzutti
Google prints a down gap on earnings news.
Position: N/A
Paolo Pezzutti
Author of the book "Trading the US Markets - A Comprehensive Guide to US Markets for International Traders and Investors" - Harriman House (July 2008)
PRINT THIS ARTICLE
TECHNICAL ANALYSIS
Is The Google Uptrend Finished?
07/24/07 12:35:42 PMby Paolo Pezzutti
Google prints a down gap on earnings news.
Position: N/A
| Google's earning release on Friday July 20 hit the stock heavily, with GOOG falling more than 5% during the trading session. Google reported revenues of $3.87 billion for the quarter ended June 30, 2007, with an increase of 58% compared to the second quarter of 2006. The net income for the second quarter of 2007 was $925 million compared to $1 billion in the first quarter of 2007 and $721 million of second-quarter 2006. The results are not bad. This is a company that makes $1 billion profit every three months, but the stock market was somewhat disappointed and the stock price has plunged since then. Gaps can be divided into four categories: - Common gaps, which occur in a trading range and are not significant. They are filled very often; - Breakaway gaps, which occur when prices climb above/below a trading range and prices break out into a new trend move; - Continuation gaps, which occur when a trend accelerates; - Exhaustion gaps, which occur after an extended trend and are soon followed by a trend reversal. |

|
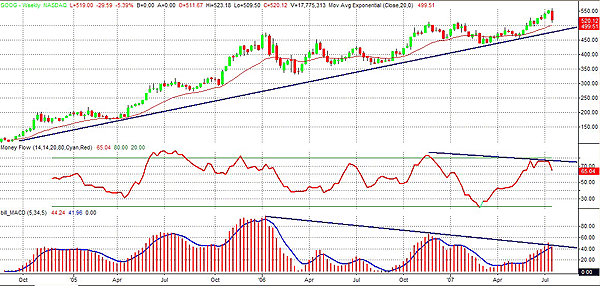
| FIGURE 1: GOOG, WEEKLY. The MACD and money flow negative divergences have been developed in coincidence with the last top. The uptrend at the weekly level is still intact as prices remain above the rising trendline. |
| Graphic provided by: TradeStation. |
| |
| In this case, after a prolonged uptrend, GOOG may have printed a breakaway gap to the downside. There are several elements that point in this direction. Let's start with the weekly chart in Figure 1. Since early 2006, GOOG has developed continued to move higher. This coincides with a negative divergence of the moving average convergence/divergence (MACD). The last top highlights a divergence of the money flow indicator as well. Note, however, that prices have been moving above a rising trendline. Prices, although last week was very weak, are still well above that supporting trendline so far. |

|
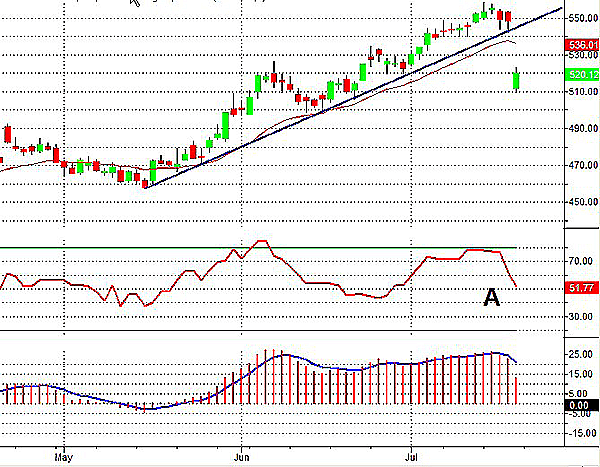
| FIGURE 2: GOOG, DAILY. Also at the daily level, GOOG has printed negative divergences. Note the breakout to the downside of the rising trendline. |
| Graphic provided by: TradeStation. |
| |
| Also on the daily chart in Figure 2, GOOG displays slight negative divergences of MACD and money flow (point A). The rising trendline that supported that upmove since mid-May has been clearly left to the downside. More than one indicator highlights a situation of negative divergence, although we have seen in the past months that they have not worked well in signaling potential reversal conditions. |

|
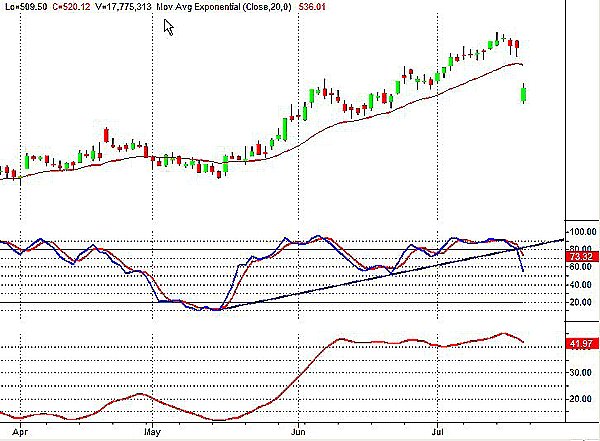
| FIGURE 3: GOOG, DAILY. The stochastic slow has turned to the downside and left the overbought area. The ADX presents a very high value, which confirms the strength of the ongoing trend. |
| Graphic provided by: TradeStation. |
| |
| In Figure 3, you can see that the slow stochastic has also left the overbought condition and indicates further weakness. As you can see, the average directional movement index (ADX) indicates that a very strong trend is still ongoing. It is generally assessed that values above 30 show evidence of an ongoing trend, and here the ADX is more than 41. |
| What can we expect, then? Big gaps often are printed on news releases that have an emotional impact on the public. They normally print very high volume. On July 20, GOOG printed the highest volume since April 2006. Statistically, big gaps like these especially, when printed against the prevailing trend, tend to overreact to news. With the following days and weeks, you often can see at least a tentative resumption of the main trend and a closing of the gap. Sometimes, as has happened after last February's selloff, stocks can even print new highs. All the selloffs that occurred lately have been seen by investors as buying opportunities. Given the strong ongoing trend, I would expect at least a tentative close to the down gap. This may not happen immediately as the overall market conditions seem to weaken. In summary, I would not open a short position before assessing the strength of the stock in attempting to close the gap. Trading the gap closure to the upside is an option, but it has to be done with a sound stop-loss in place. |
Author of the book "Trading the US Markets - A Comprehensive Guide to US Markets for International Traders and Investors" - Harriman House (July 2008)
| Address: | VIA ROBERTO AGO 26 POSTAL CODE 00166 |
| Rome, ITALY | |
| Phone # for sales: | +393357540708 |
| E-mail address: | pezzutti.paolo@tiscali.it |
Click here for more information about our publications!
PRINT THIS ARTICLE

Request Information From Our Sponsors
- StockCharts.com, Inc.
- Candle Patterns
- Candlestick Charting Explained
- Intermarket Technical Analysis
- John Murphy on Chart Analysis
- John Murphy's Chart Pattern Recognition
- John Murphy's Market Message
- MurphyExplainsMarketAnalysis-Intermarket Analysis
- MurphyExplainsMarketAnalysis-Visual Analysis
- StockCharts.com
- Technical Analysis of the Financial Markets
- The Visual Investor
- VectorVest, Inc.
- Executive Premier Workshop
- One-Day Options Course
- OptionsPro
- Retirement Income Workshop
- Sure-Fire Trading Systems (VectorVest, Inc.)
- Trading as a Business Workshop
- VectorVest 7 EOD
- VectorVest 7 RealTime/IntraDay
- VectorVest AutoTester
- VectorVest Educational Services
- VectorVest OnLine
- VectorVest Options Analyzer
- VectorVest ProGraphics v6.0
- VectorVest ProTrader 7
- VectorVest RealTime Derby Tool
- VectorVest Simulator
- VectorVest Variator
- VectorVest Watchdog
