HOT TOPICS LIST
- MACD
- Fibonacci
- RSI
- Gann
- ADXR
- Stochastics
- Volume
- Triangles
- Futures
- Cycles
- Volatility
- ZIGZAG
- MESA
- Retracement
- Aroon
INDICATORS LIST
LIST OF TOPICS
PRINT THIS ARTICLE
by Koos van der Merwe
Pharmaceutical companies spend millions of dollars in developing products that can be wiped out by the Powers That Be that decide whether the product is safe enough to be sold to the general population.
Position: Accumulate
Koos van der Merwe
Has been a technical analyst since 1969, and has worked as a futures and options trader with First Financial Futures in Johannesburg, South Africa.
PRINT THIS ARTICLE
FLAGS AND PENNANTS
The Cooper Companies
07/24/07 09:13:26 AMby Koos van der Merwe
Pharmaceutical companies spend millions of dollars in developing products that can be wiped out by the Powers That Be that decide whether the product is safe enough to be sold to the general population.
Position: Accumulate
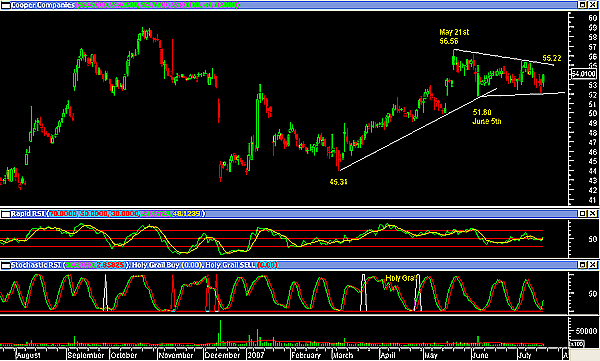
| That said, why invest in a Pfizer or a Biovail, both of which recently took a knock in the market as their products proved faulty? The answer is, of course, that when they find that magic product, as Nucrystpharma in Canada has recently, the stock price can double. The Cooper Cos. (COO) hit my explorer list, meeting my technical parameters. Whether profits are good or the company is developing and soon to promote a new moneymaking product is anyone's guess. Below are the technical reasons we should pay attention to the stock. The Cooper Cos.' provide two medical device markets: CooperVision, which markets a broad range of contact lenses throughout the world, and CooperSurgical, a company that markets diagnostic products, surgical instruments, and accessories for the women's health care market. Figure 1 is a MetaStock chart that shows why the company made my watchlist. |

|
| FIGURE 1: COOPER COS. This chart shows the signals that brought the company to the author's attention |
| Graphic provided by: MetaStock. |
| |
| The trigger that highlighted the company was the stochastic relative strength index (RSI), which gave me a buy signal on July 18 when the price was $52.85. The holy grail indicator displayed in the same window had given a buy signal on April 26 when the price was $49.31, so in effect, the current buy signal is a confirmatory signal. However, what discouraged me from accepting the April 26th buy signal was the fact that the rapid RSI in the upper window was above the 50 horizontal line, suggesting there was further weakness ahead. After the stock price peaked at $56.56 on May 21, the price did indeed fall back to $51.60 by June 5. The chart does show that a triangle formation could be developing, suggesting a target of $62.79, should it break above the upper resistance line at $55.22 (56.5-45.31 = 11.19 + 51.60 = 62.79). Volume is low as the price rises but could be kissing the 28-period simple moving average, the trigger used to highlight above-average volume. |

|
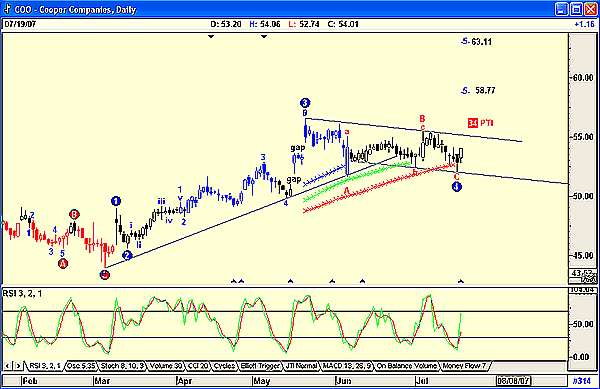
| FIGURE 2: COOPER COS., DAILY. This chart shows an Elliott wave analysis and count of the company. |
| Graphic provided by: AdvancedGET. |
| |
| Figure 2 shows the Elliott wave count as applied by the program to the chart. It is suggesting that a wave 4 has been competed with a 34% probability that a wave 5 top could target $58.77 or $63.11. The RSI shown is a three-period RSI wirth a two-period moving average of the RSI. The indicator is a good one for short-term trading. It is currently showing a buy signal but does not suggest that the price could break the upper resistance line of the flag shown. |
| To conclude, the stock should be watched for a possible breakout. Short-term traders could buy now and sell as the price hits the upper resistance line. Long-term investors would buy as the price breaks the upper resistance line of the flag. |
Has been a technical analyst since 1969, and has worked as a futures and options trader with First Financial Futures in Johannesburg, South Africa.
| Address: | 3256 West 24th Ave |
| Vancouver, BC | |
| Phone # for sales: | 6042634214 |
| E-mail address: | petroosp@gmail.com |
Click here for more information about our publications!
PRINT THIS ARTICLE

Request Information From Our Sponsors
- VectorVest, Inc.
- Executive Premier Workshop
- One-Day Options Course
- OptionsPro
- Retirement Income Workshop
- Sure-Fire Trading Systems (VectorVest, Inc.)
- Trading as a Business Workshop
- VectorVest 7 EOD
- VectorVest 7 RealTime/IntraDay
- VectorVest AutoTester
- VectorVest Educational Services
- VectorVest OnLine
- VectorVest Options Analyzer
- VectorVest ProGraphics v6.0
- VectorVest ProTrader 7
- VectorVest RealTime Derby Tool
- VectorVest Simulator
- VectorVest Variator
- VectorVest Watchdog
- StockCharts.com, Inc.
- Candle Patterns
- Candlestick Charting Explained
- Intermarket Technical Analysis
- John Murphy on Chart Analysis
- John Murphy's Chart Pattern Recognition
- John Murphy's Market Message
- MurphyExplainsMarketAnalysis-Intermarket Analysis
- MurphyExplainsMarketAnalysis-Visual Analysis
- StockCharts.com
- Technical Analysis of the Financial Markets
- The Visual Investor
