HOT TOPICS LIST
- MACD
- Fibonacci
- RSI
- Gann
- ADXR
- Stochastics
- Volume
- Triangles
- Futures
- Cycles
- Volatility
- ZIGZAG
- MESA
- Retracement
- Aroon
INDICATORS LIST
LIST OF TOPICS
PRINT THIS ARTICLE
by Arthur Hill
Starbucks has been trending lower since November, but the stock is showing signs of firmness and follow-through on a candlestick reversal.
Position: Accumulate
Arthur Hill
Arthur Hill is currently editor of TDTrader.com, a website specializing in trading strategies, sector/industry specific breadth stats and overall technical analysis. He passed the Society of Technical Analysts (STA London) diploma exam with distinction is a Certified Financial Technician (CFTe). Prior to TD Trader, he was the Chief Technical Analyst for Stockcharts.com and the main contributor to the ChartSchool.
PRINT THIS ARTICLE
CANDLESTICK CHARTING
Bottom Fishing In Starbucks
07/24/07 08:48:59 AMby Arthur Hill
Starbucks has been trending lower since November, but the stock is showing signs of firmness and follow-through on a candlestick reversal.
Position: Accumulate
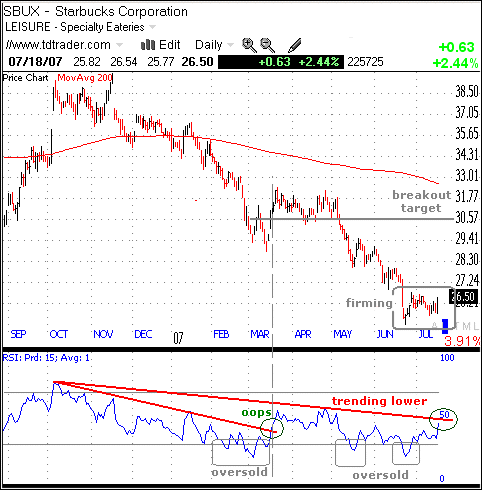
| Figure 1 shows Starbucks (SBUX) and the decline from November to June. Except for a brief bounce in March and some firmness in April, it has been pretty much all downhill since November. The stock declined sharply at the end of June, but managed to firm immediately after this decline, and SBUX could be preparing for a long overdue bounce. |

|
| FIGURE 1: SBUX, DAILY. Starbucks declined from November to June. |
| Graphic provided by: Telechart 2007. |
| |
| The relative strength index (RSI) shows that the stock became oversold and remained oversold; 30 is considered oversold for the RSI, and the stock first moved below 30 in February. The stock remained oversold as the RSI dipped back below 30 at least four more times and the stock lost another 20%. The RSI bounced with the stock in March and broke its downtrend line, but this breakout proved futile as well. There is now a long trendline extending down from the October high, and a move above 50 would reverse the downtrend in momentum. This could be used to confirm a breakout on the candlestick chart. |

|
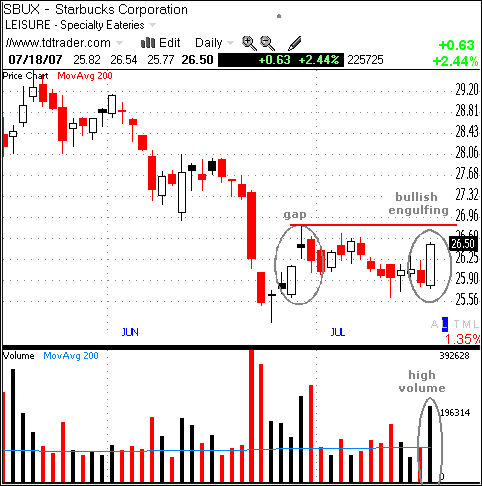
| FIGURE 2: SBUX, DAILY. The stock gapped higher at the end of June and formed a bullish engulfing on July 18 (see ovals). |
| Graphic provided by: Telechart 2007. |
| |
| Turning to a shorter time frame, the stock gapped higher at the end of June and formed a bullish engulfing on July 18 (gray ovals) (Figure 2). The gap did not hold, but the ability to gap up after the late June decline shows some resilience. In addition, the stock managed to hold above its June lows and the bullish engulfing reinforces support around 25.5. The bullish engulfing forms when the open is below the prior close and the close is above the prior open. The long white candlestick completely engulfs the prior candlestick as prices reverse course after the open. Follow-through is required for confirmation and a break above the late June high (26.82) would do the trick. |
| High volume further confirms the bullish engulfing and increases the chances of a breakout. The candlestick reversal formed on the highest volume of the month, and this shows a strong increase in buying pressure. A break above the late June high would target a move to the next resistance area around 30–31 and support would be based on the July low. |
Arthur Hill is currently editor of TDTrader.com, a website specializing in trading strategies, sector/industry specific breadth stats and overall technical analysis. He passed the Society of Technical Analysts (STA London) diploma exam with distinction is a Certified Financial Technician (CFTe). Prior to TD Trader, he was the Chief Technical Analyst for Stockcharts.com and the main contributor to the ChartSchool.
| Title: | Editor |
| Company: | TDTrader.com |
| Address: | Willem Geetsstraat 17 |
| Mechelen, B2800 | |
| Phone # for sales: | 3215345465 |
| Website: | www.tdtrader.com |
| E-mail address: | arthurh@tdtrader.com |
Traders' Resource Links | |
| TDTrader.com has not added any product or service information to TRADERS' RESOURCE. | |
Click here for more information about our publications!
PRINT THIS ARTICLE

Request Information From Our Sponsors
- VectorVest, Inc.
- Executive Premier Workshop
- One-Day Options Course
- OptionsPro
- Retirement Income Workshop
- Sure-Fire Trading Systems (VectorVest, Inc.)
- Trading as a Business Workshop
- VectorVest 7 EOD
- VectorVest 7 RealTime/IntraDay
- VectorVest AutoTester
- VectorVest Educational Services
- VectorVest OnLine
- VectorVest Options Analyzer
- VectorVest ProGraphics v6.0
- VectorVest ProTrader 7
- VectorVest RealTime Derby Tool
- VectorVest Simulator
- VectorVest Variator
- VectorVest Watchdog
- StockCharts.com, Inc.
- Candle Patterns
- Candlestick Charting Explained
- Intermarket Technical Analysis
- John Murphy on Chart Analysis
- John Murphy's Chart Pattern Recognition
- John Murphy's Market Message
- MurphyExplainsMarketAnalysis-Intermarket Analysis
- MurphyExplainsMarketAnalysis-Visual Analysis
- StockCharts.com
- Technical Analysis of the Financial Markets
- The Visual Investor
